

Tokenization Analytics
Overview
The Tokenization Analytics module provides comprehensive insights and monitoring capabilities for all tokenization data processed through the Juspay payment platform. It offers real-time and historical analysis of tokenization performance, success rates, processing times, and detailed breakdowns across various business dimensions with multiple viewing modes for different analytical perspectives.
This module is designed for a wide range of users, including:
Operations Teams: For monitoring tokenization processing performance and identifying bottlenecks across different payment methods and gateways.
Finance Teams: For tracking tokenization volumes, success rates, revenue analysis, and financial impact assessment across multiple currencies.
Customer Support: To investigate tokenization issues, analyze customer behavior patterns, and provide accurate status updates to customers.
Accessing the Module
Log in to the Juspay dashboard.
From the main navigation menu on the left, click on Analytics.
Select Tokenization Analytics from the Analytics submenu.
The navigation URL for this module is https://portal.juspay.in/analytics-tokenization
 .
.
Dashboard Overview
Viewing Modes
The Tokenization Analytics module offers two distinct viewing modes, each providing different analytical perspectives:
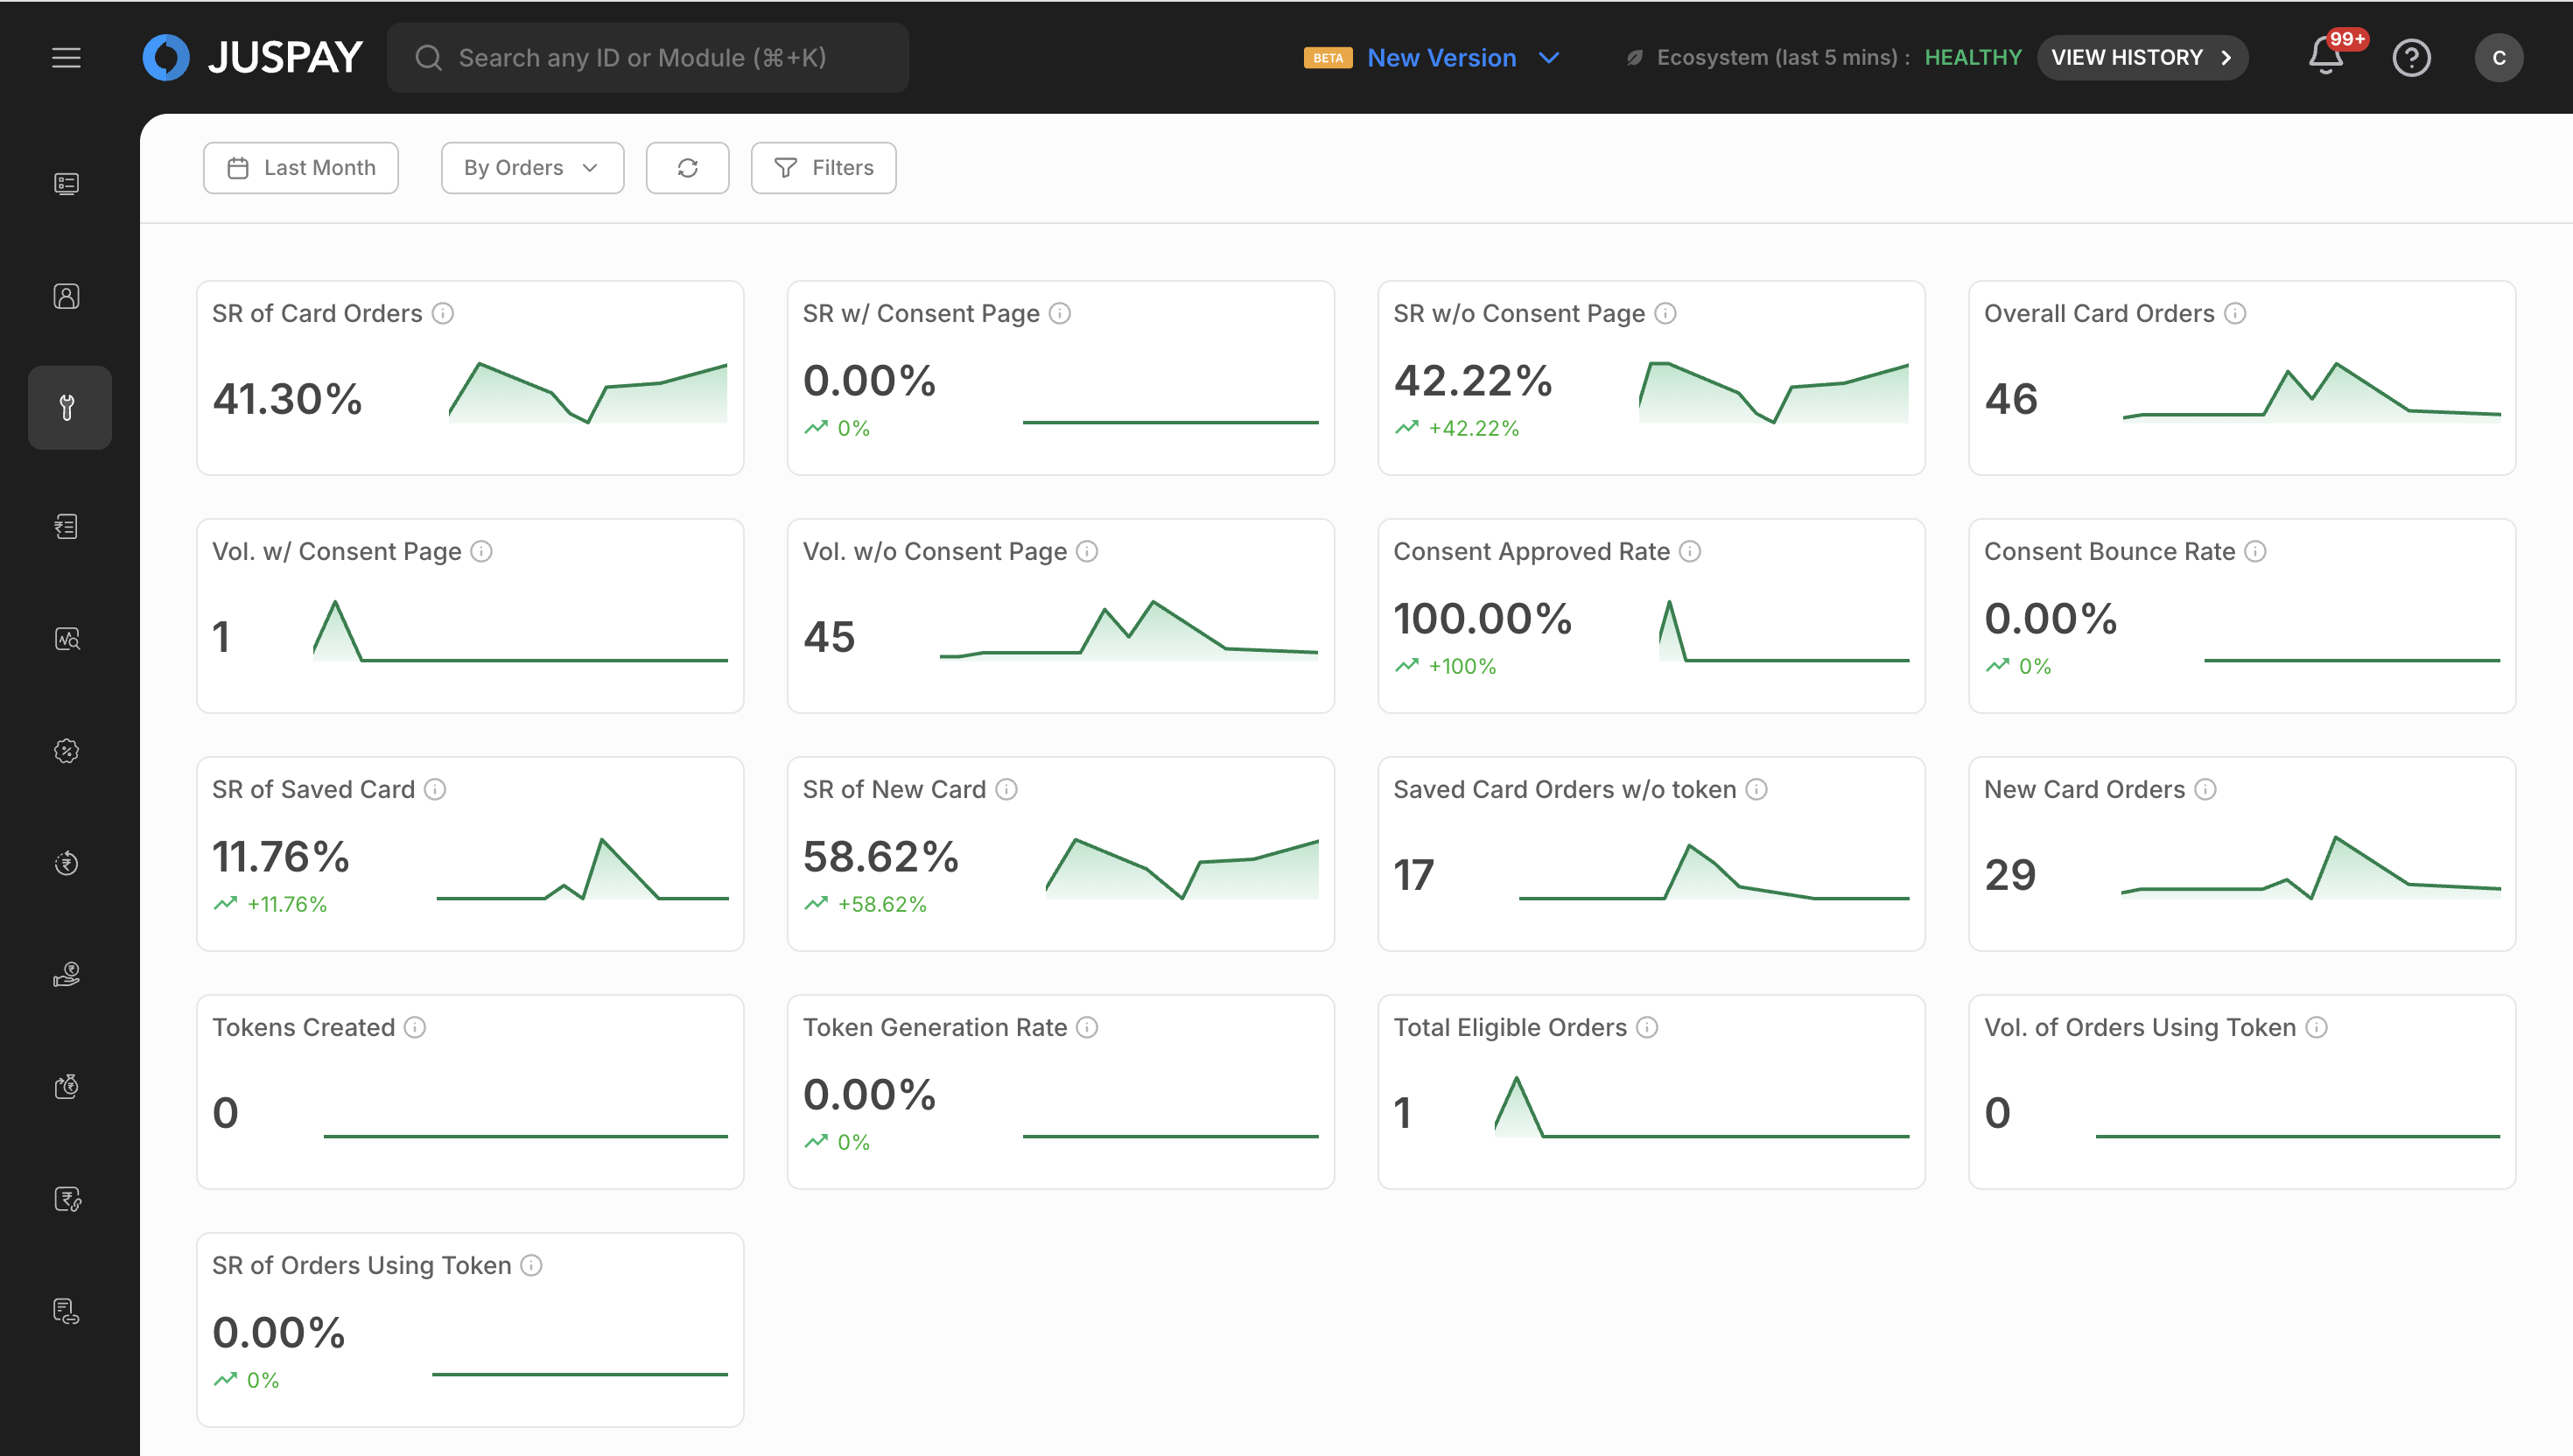
ORDER Mode (Order Level)
Purpose: Analyzes tokenization data at the order level with aggregated tokenization information
Use Case: Ideal for business analysis, order completion rates, and customer purchase behavior with tokenization
Data Granularity: One row per order with aggregated tokenization information in downloads
Metrics Focus: Order completion rates, average order values, tokenization success rates at order level
Currency Column: Uses "ord_currency" (order currency) for currency-based analysis
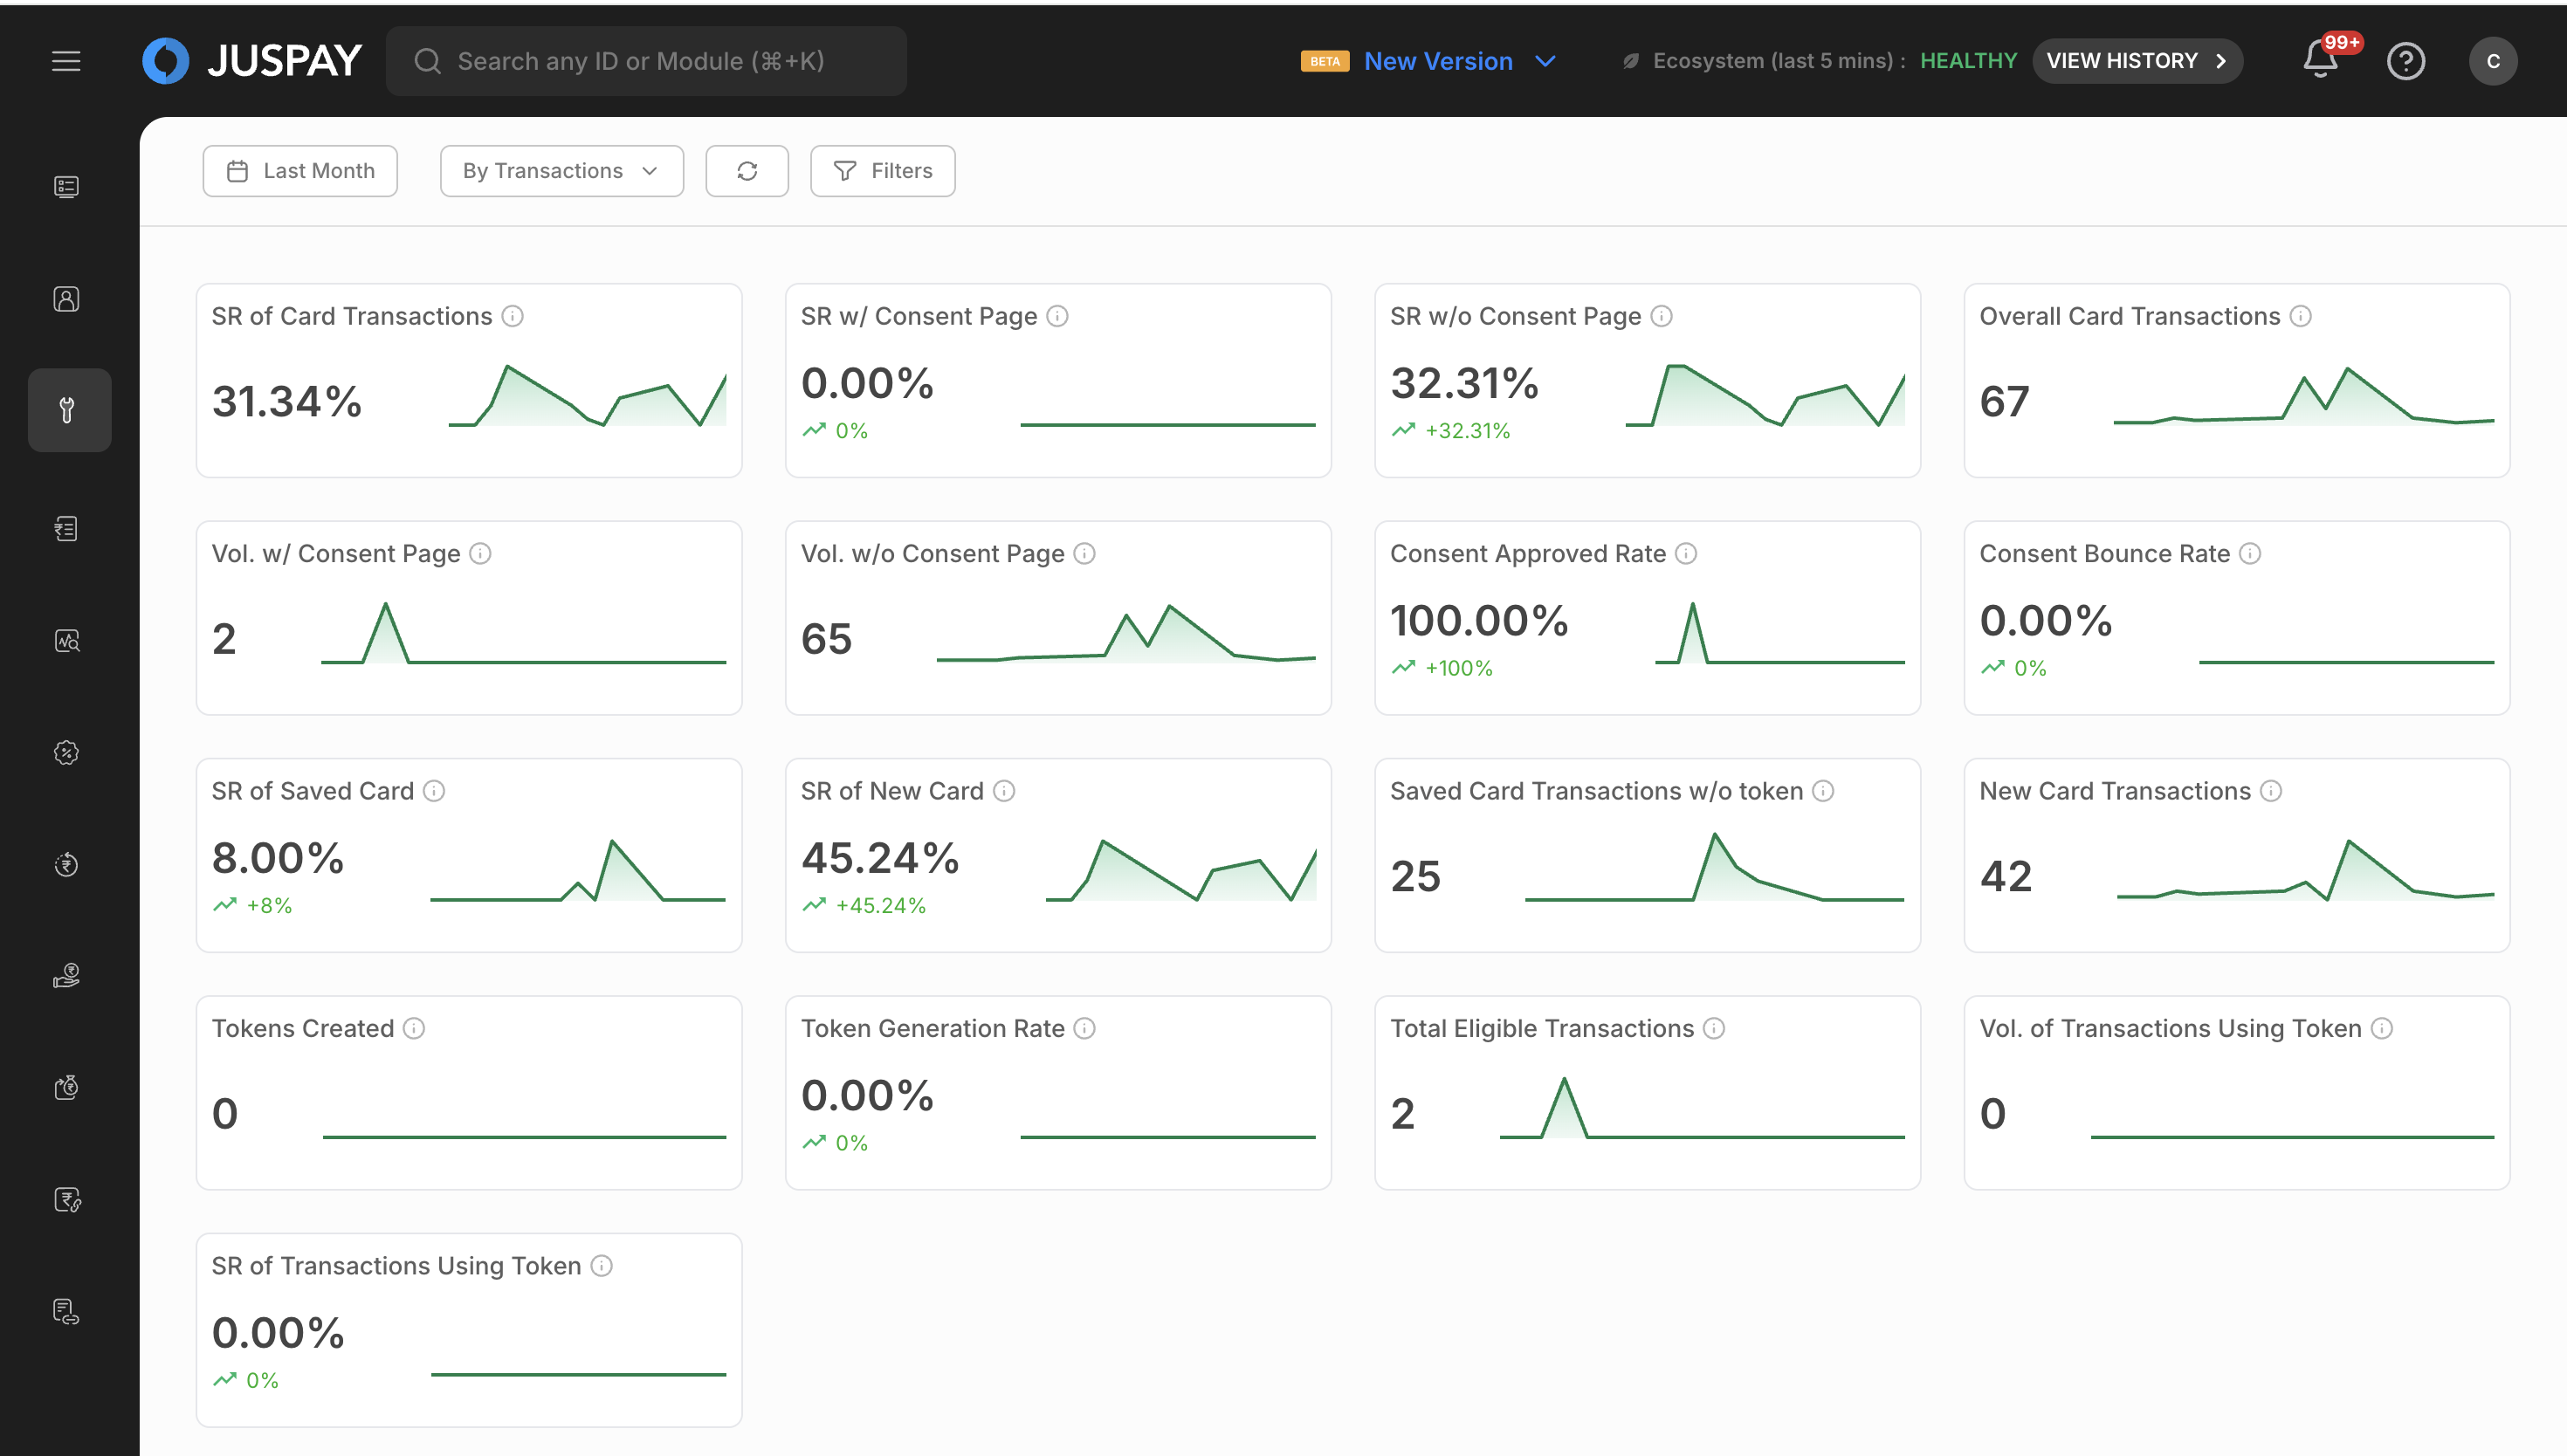
Transaction Mode (Transaction Level)
Purpose: Provides transaction-level tokenization insights
Use Case: Best for investigating specific tokenization issues, payment method performance, and detailed transaction flow analysis
Data Granularity: One row per transaction in downloads
Metrics Focus: Transaction success rates, processing times, error analysis, and payment method effectiveness
Currency Column: Uses "txn_currency" (transaction currency) for transaction-level analysis
Key Performance Metrics
The dashboard displays essential tokenization performance indicators at the top, varying by selected mode:
Common Metrics Across All Modes:
Success Rate: Percentage of successful tokenization operations out of total initiated
Total Volume: Total number of tokenization operations processed
Total Amount: Total monetary value of successful tokenization operations with multi-currency support
Error Rate: Percentage of failed tokenization operations with detailed error analysis
Mode-Specific Metrics:
ORDER Mode: Order completion rates with tokenization, average order values, order processing times
Transaction Mode: Transaction latency percentiles, payment method success rates, gateway performance
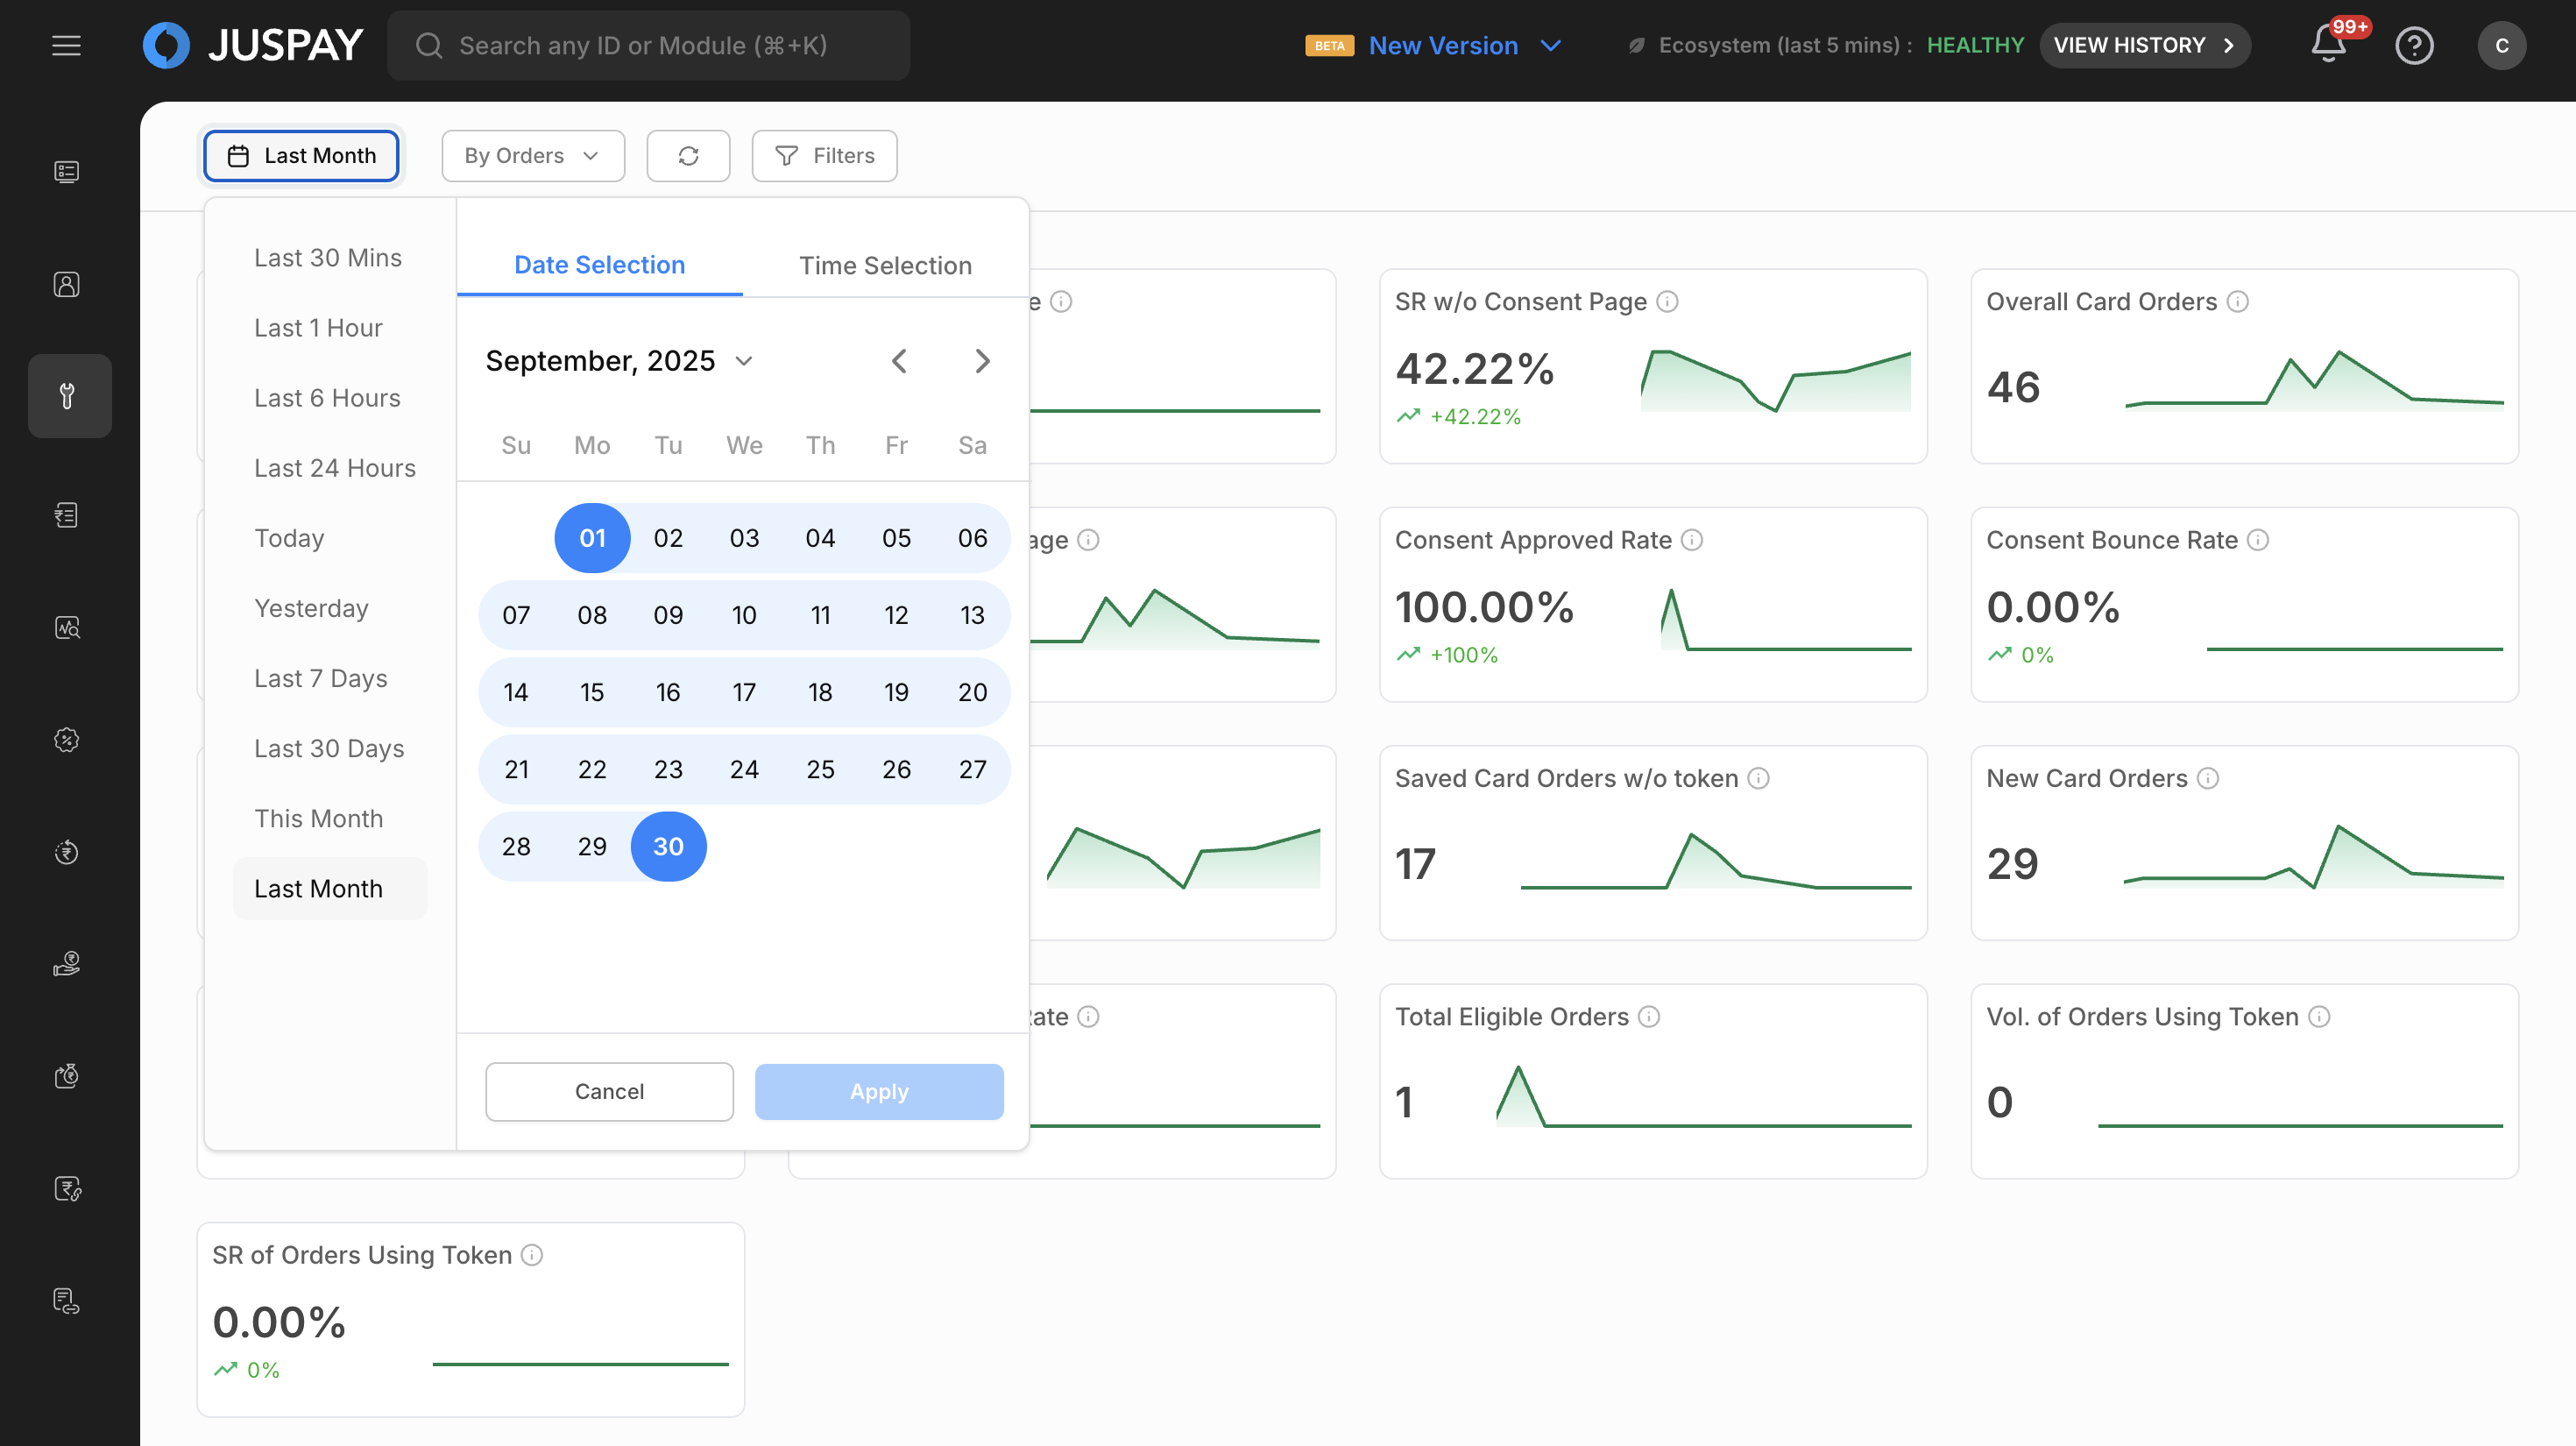
Time Range Selection
Use the date picker to select your desired time range for analysis.
The system automatically rounds times to 5-minute intervals for consistency and performance.
Choose from predefined ranges or set custom date ranges.
Click Apply to refresh all metrics and charts with the new time range.
Choose from predefined ranges or set custom date ranges.
Filtering and Segmentation
Fixed Filters (Always Available)
Date Filter
Select time range for tokenization analysis with predefined ranges (Today, Last 7 days, Last 30 days, etc.) or custom date selection. The system automatically rounds times to 5-minute intervals for performance.
Mode Filter
Switch between ORDER (Order Level) and Transaction (Transaction Level) analysis modes. Available segments and metrics change based on selected mode, with ORDER mode as the default selection.
Sync Filter
Manual data synchronization - click to refresh all dashboard data manually when you need the most current data but don't want automatic refreshing.
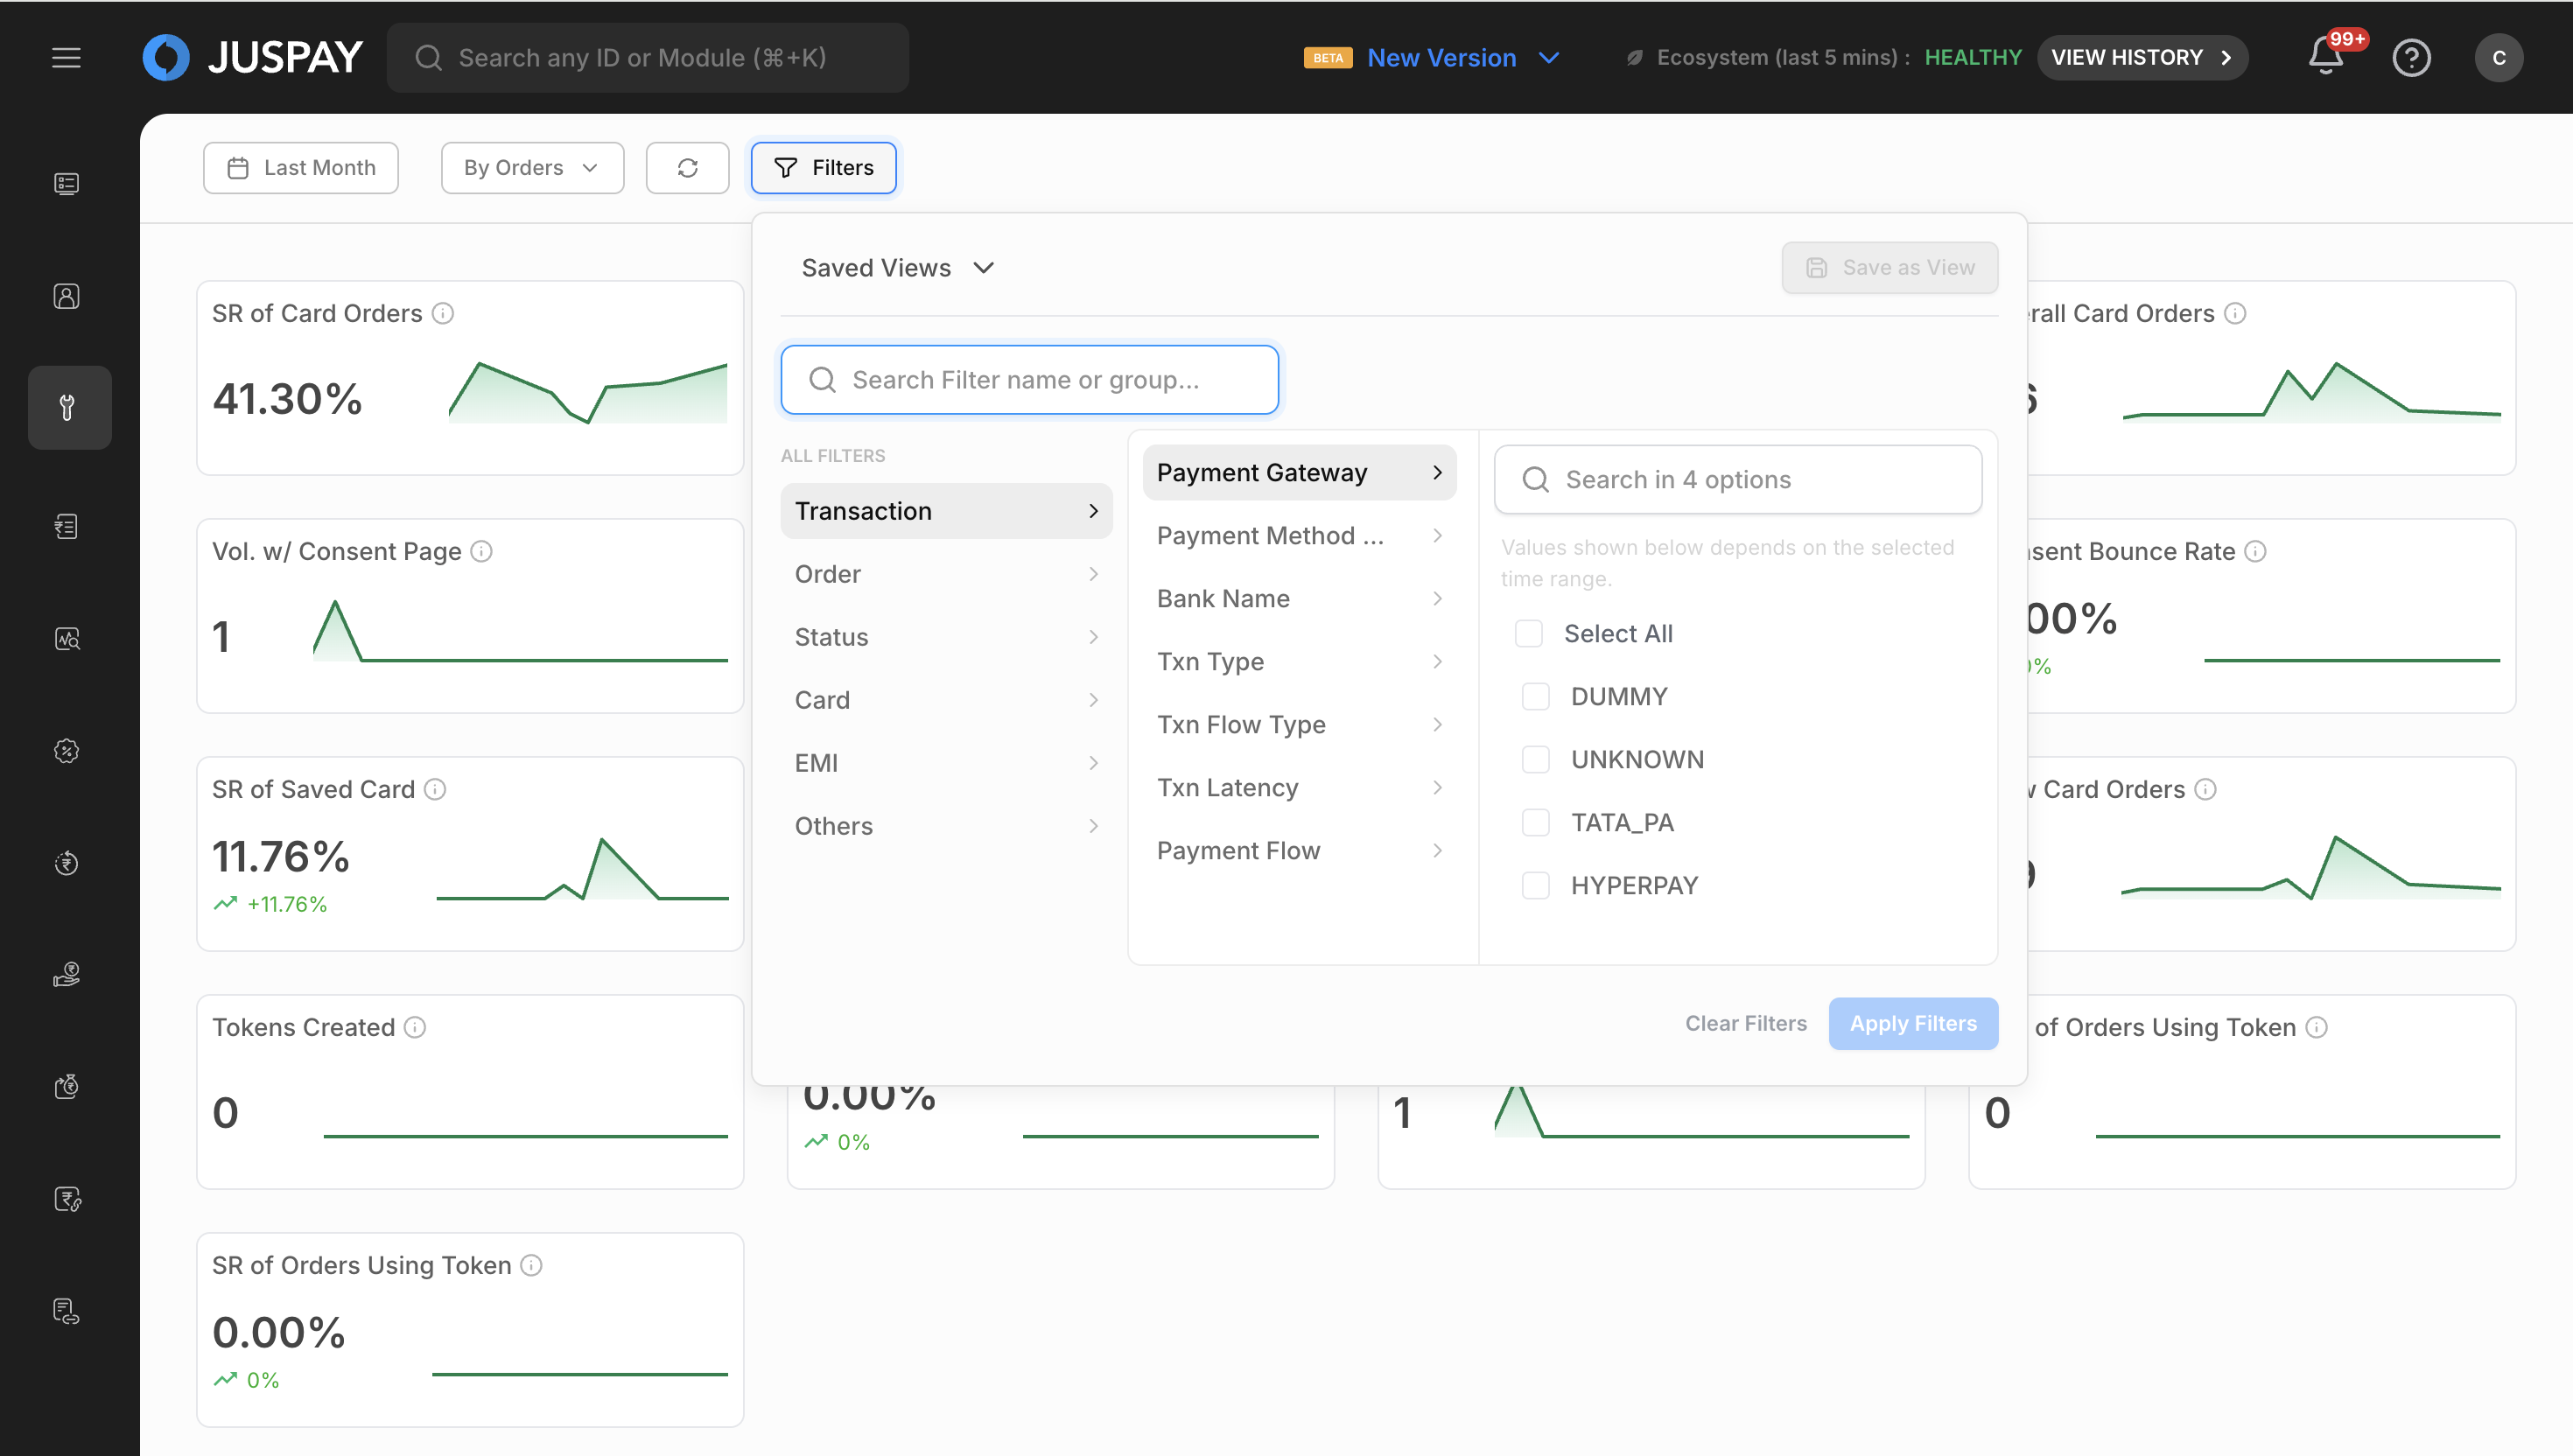
Dynamic Segments
Dynamic segments are loaded based on the selected viewing mode and provide powerful filtering capabilities. Available segments vary by ORDER/Transaction mode and are fetched from analytics endpoints based on data availability. Use search functionality to quickly find specific segments, and select up to 3 segments simultaneously (limited to 1 when time comparison is enabled).
Applying Segments
Click on the "Add Segments" button to open the segment selection panel.
Search for specific segments using the search input placeholder "Search Segments".
Select segments by clicking on them (maximum 3 selections).
Remove segments by clicking the remove button on selected segments (segments beyond the first 3 are removable).
Segments are automatically applied and update the dashboard data.
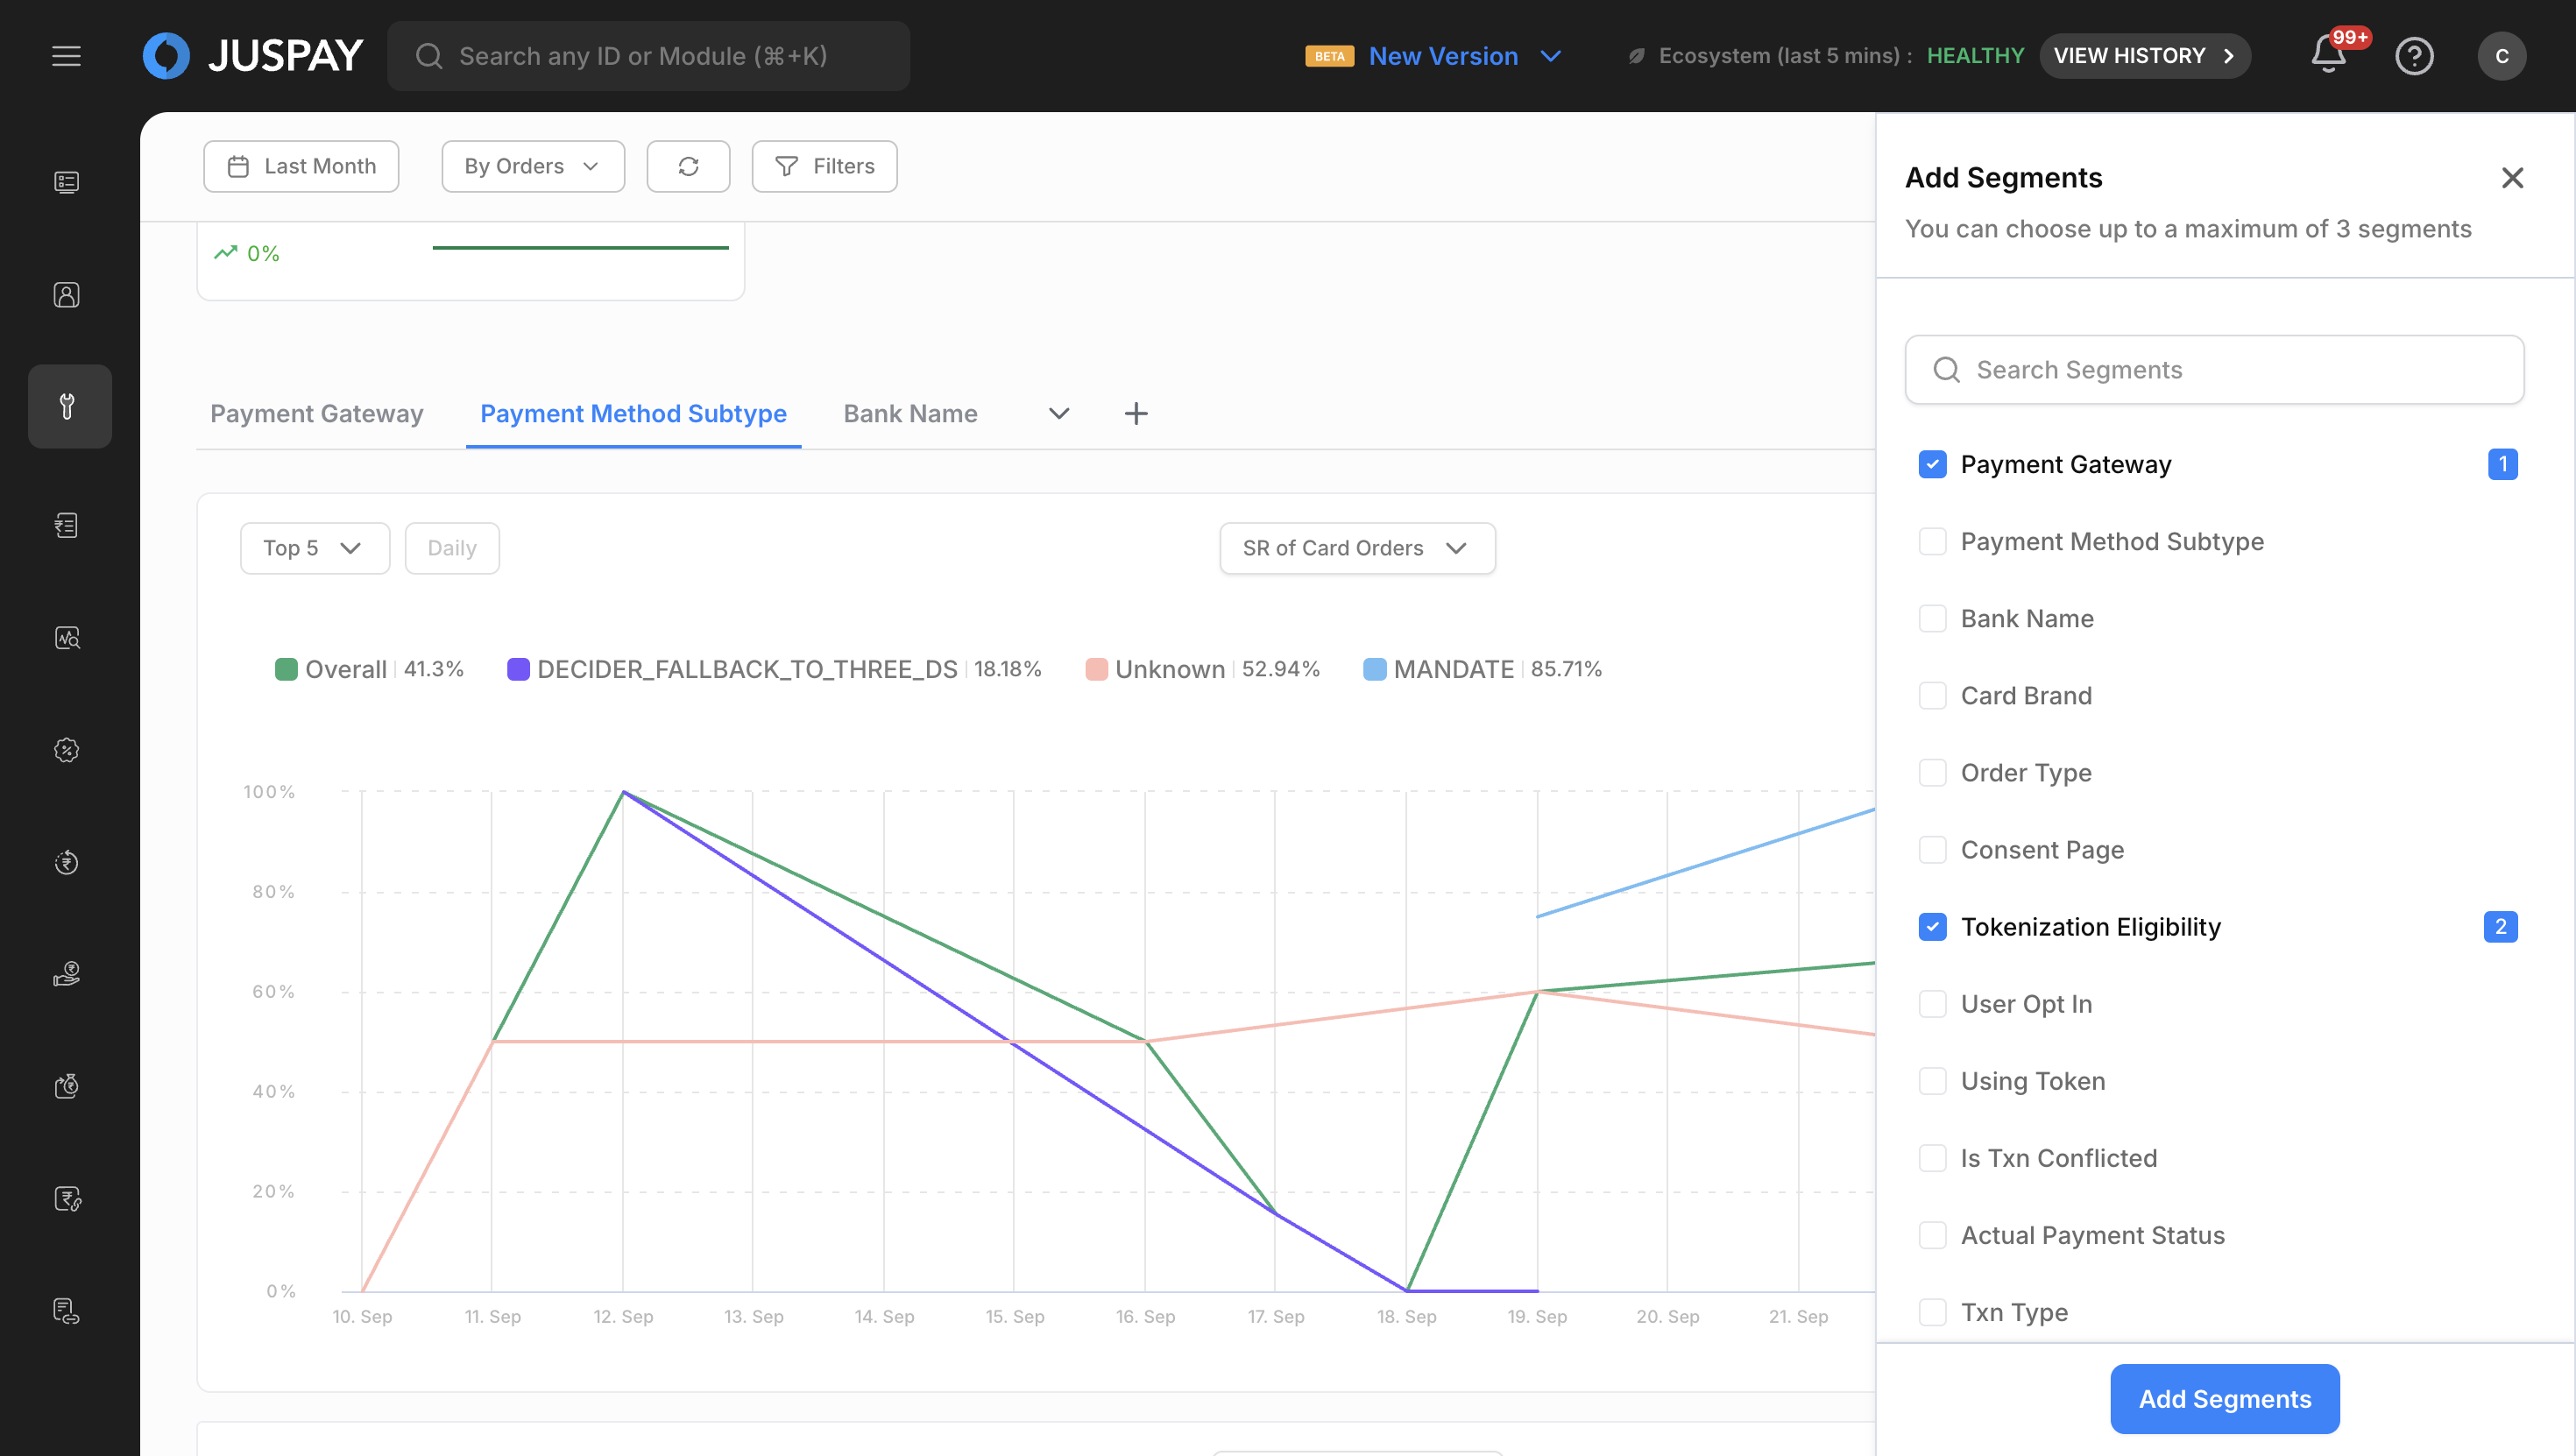
Chart Analytics
Creating and Viewing Charts
Chart Types Available
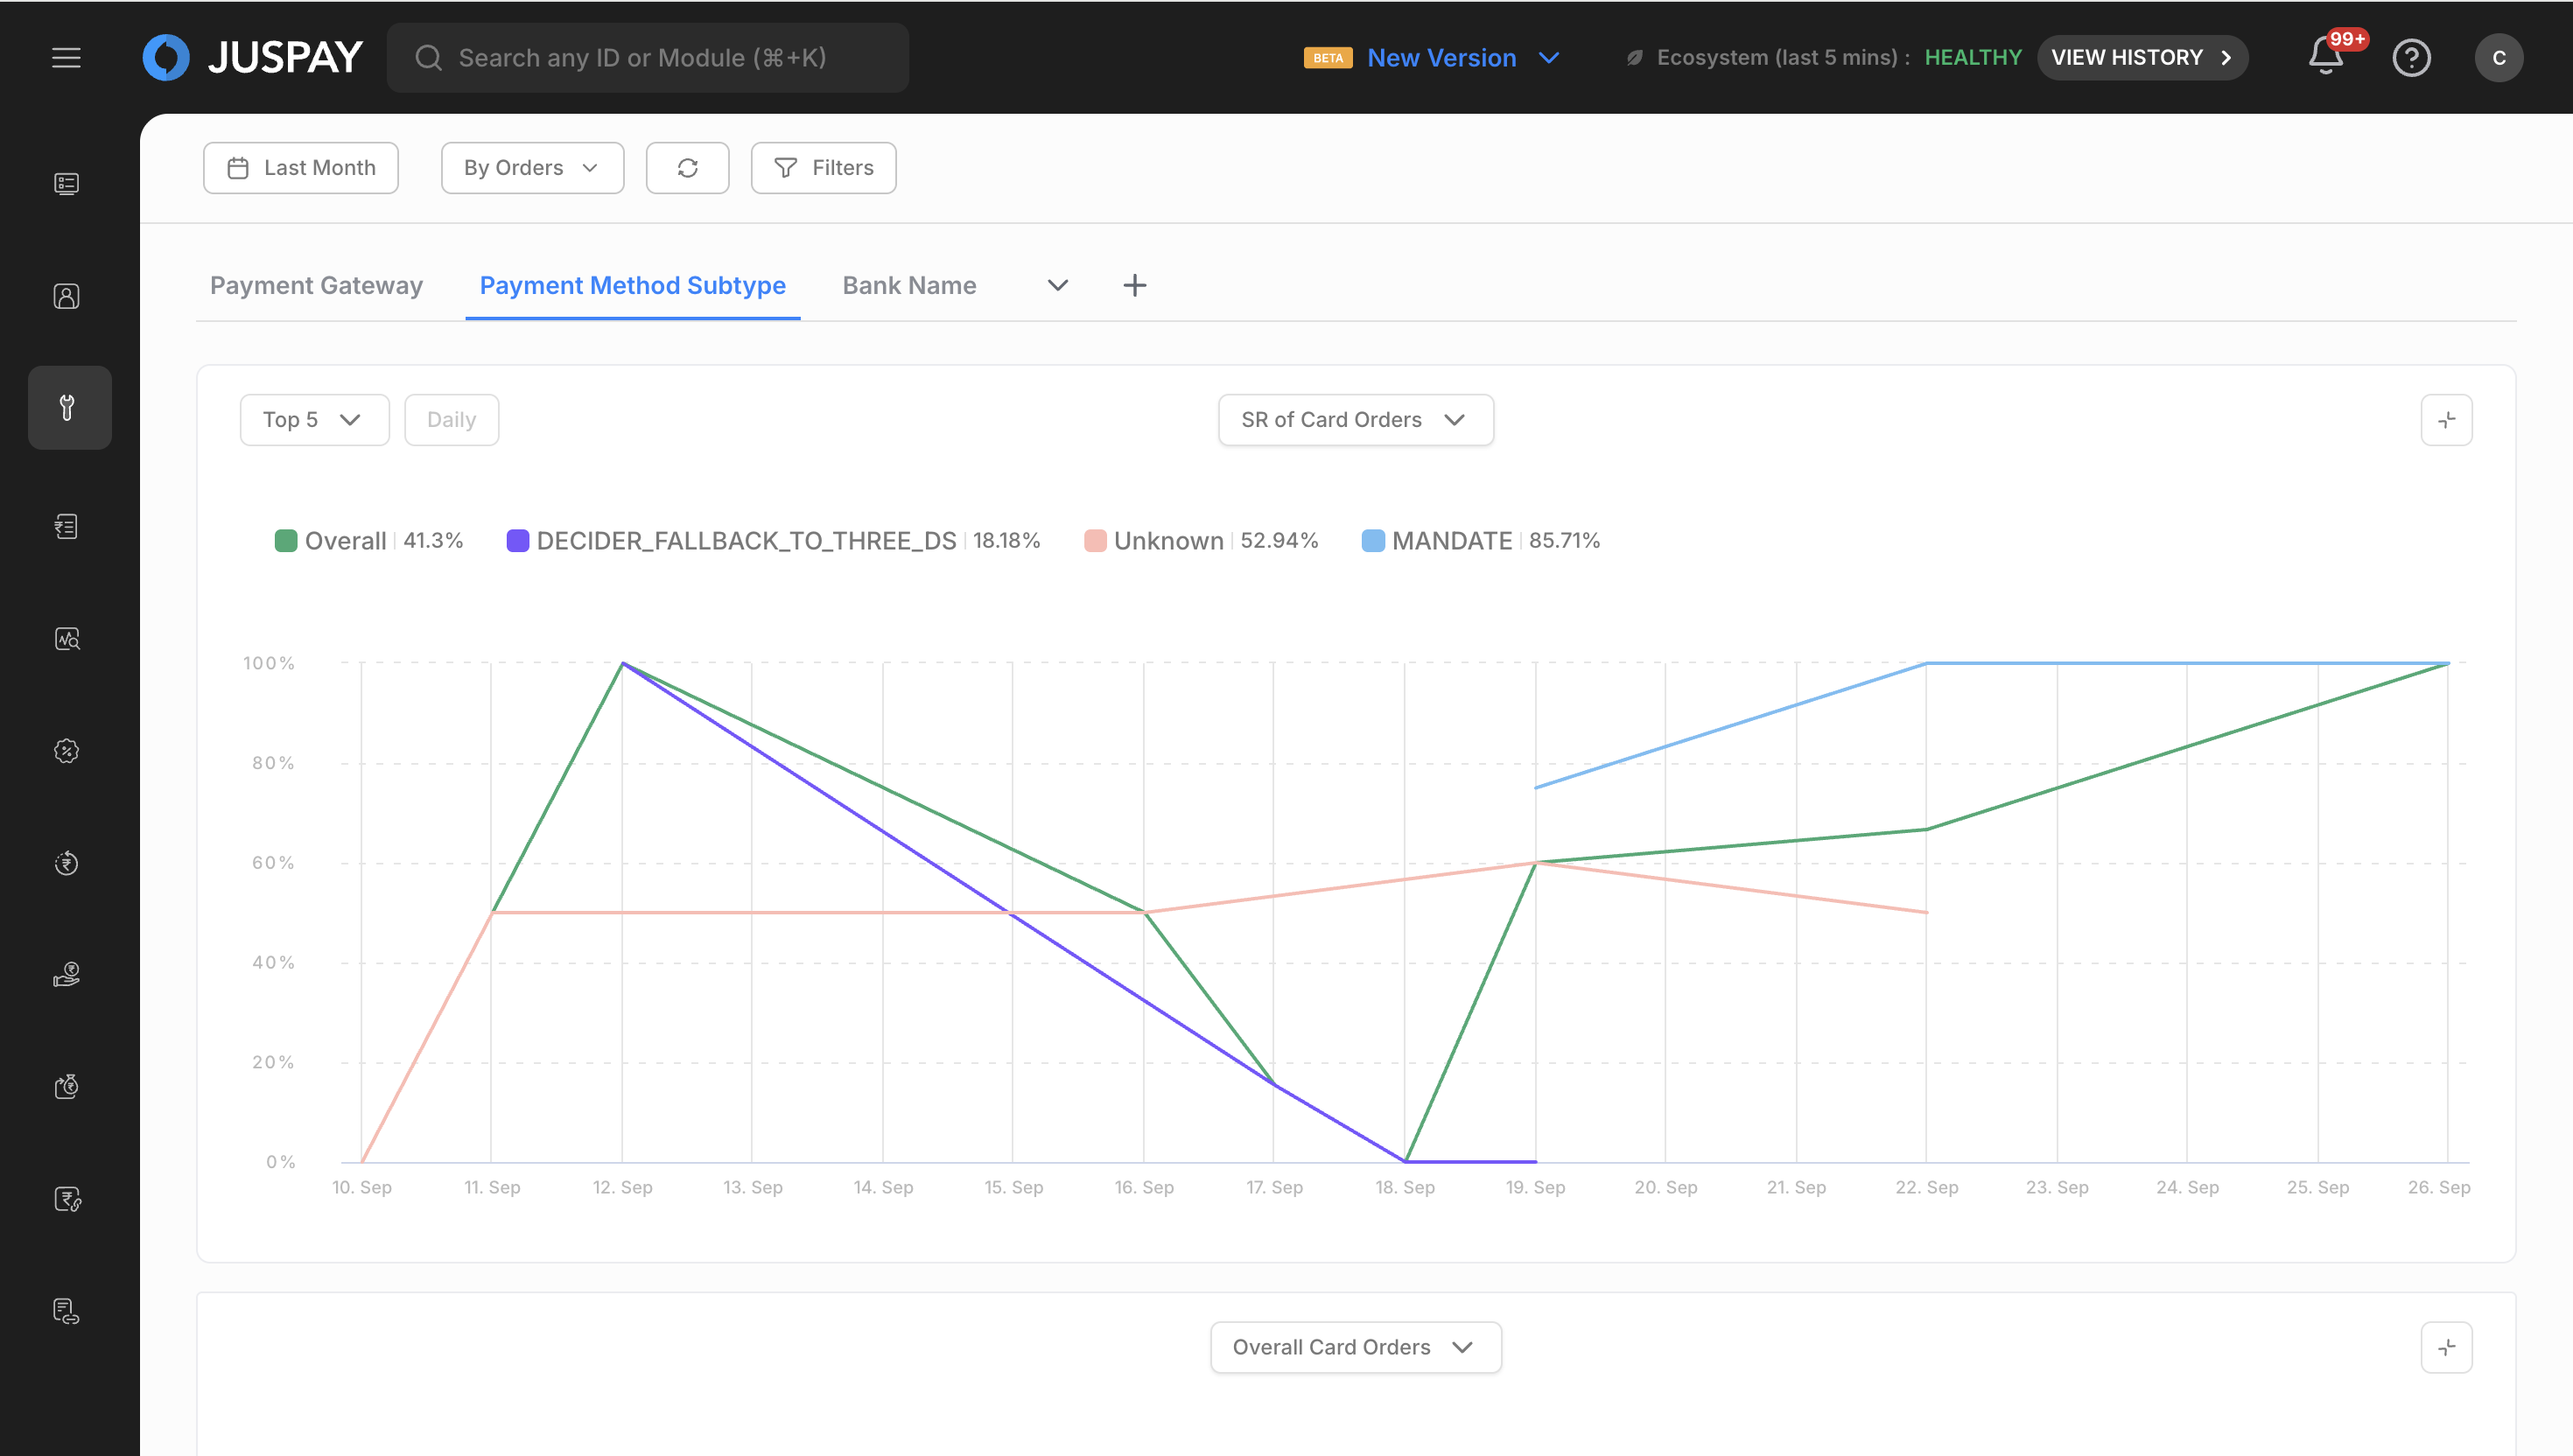
Time Series Charts: Interactive line charts showing tokenization trends over time
Multiple Metrics: Select multiple metrics for comparison across different dimensions
Chart Interactions
Hover over data points to see detailed tokenization information and tooltips.
Zoom and Pan: Use mouse or touch gestures to zoom into specific time periods.
Legend Toggle: Click legend items to show/hide specific data series.
Chart Customization
Chart Features
Advanced Interactions: Full zoom, pan, and selection capabilities
Detailed Tooltips: Comprehensive tooltip information
Export Options: Chart export functionality
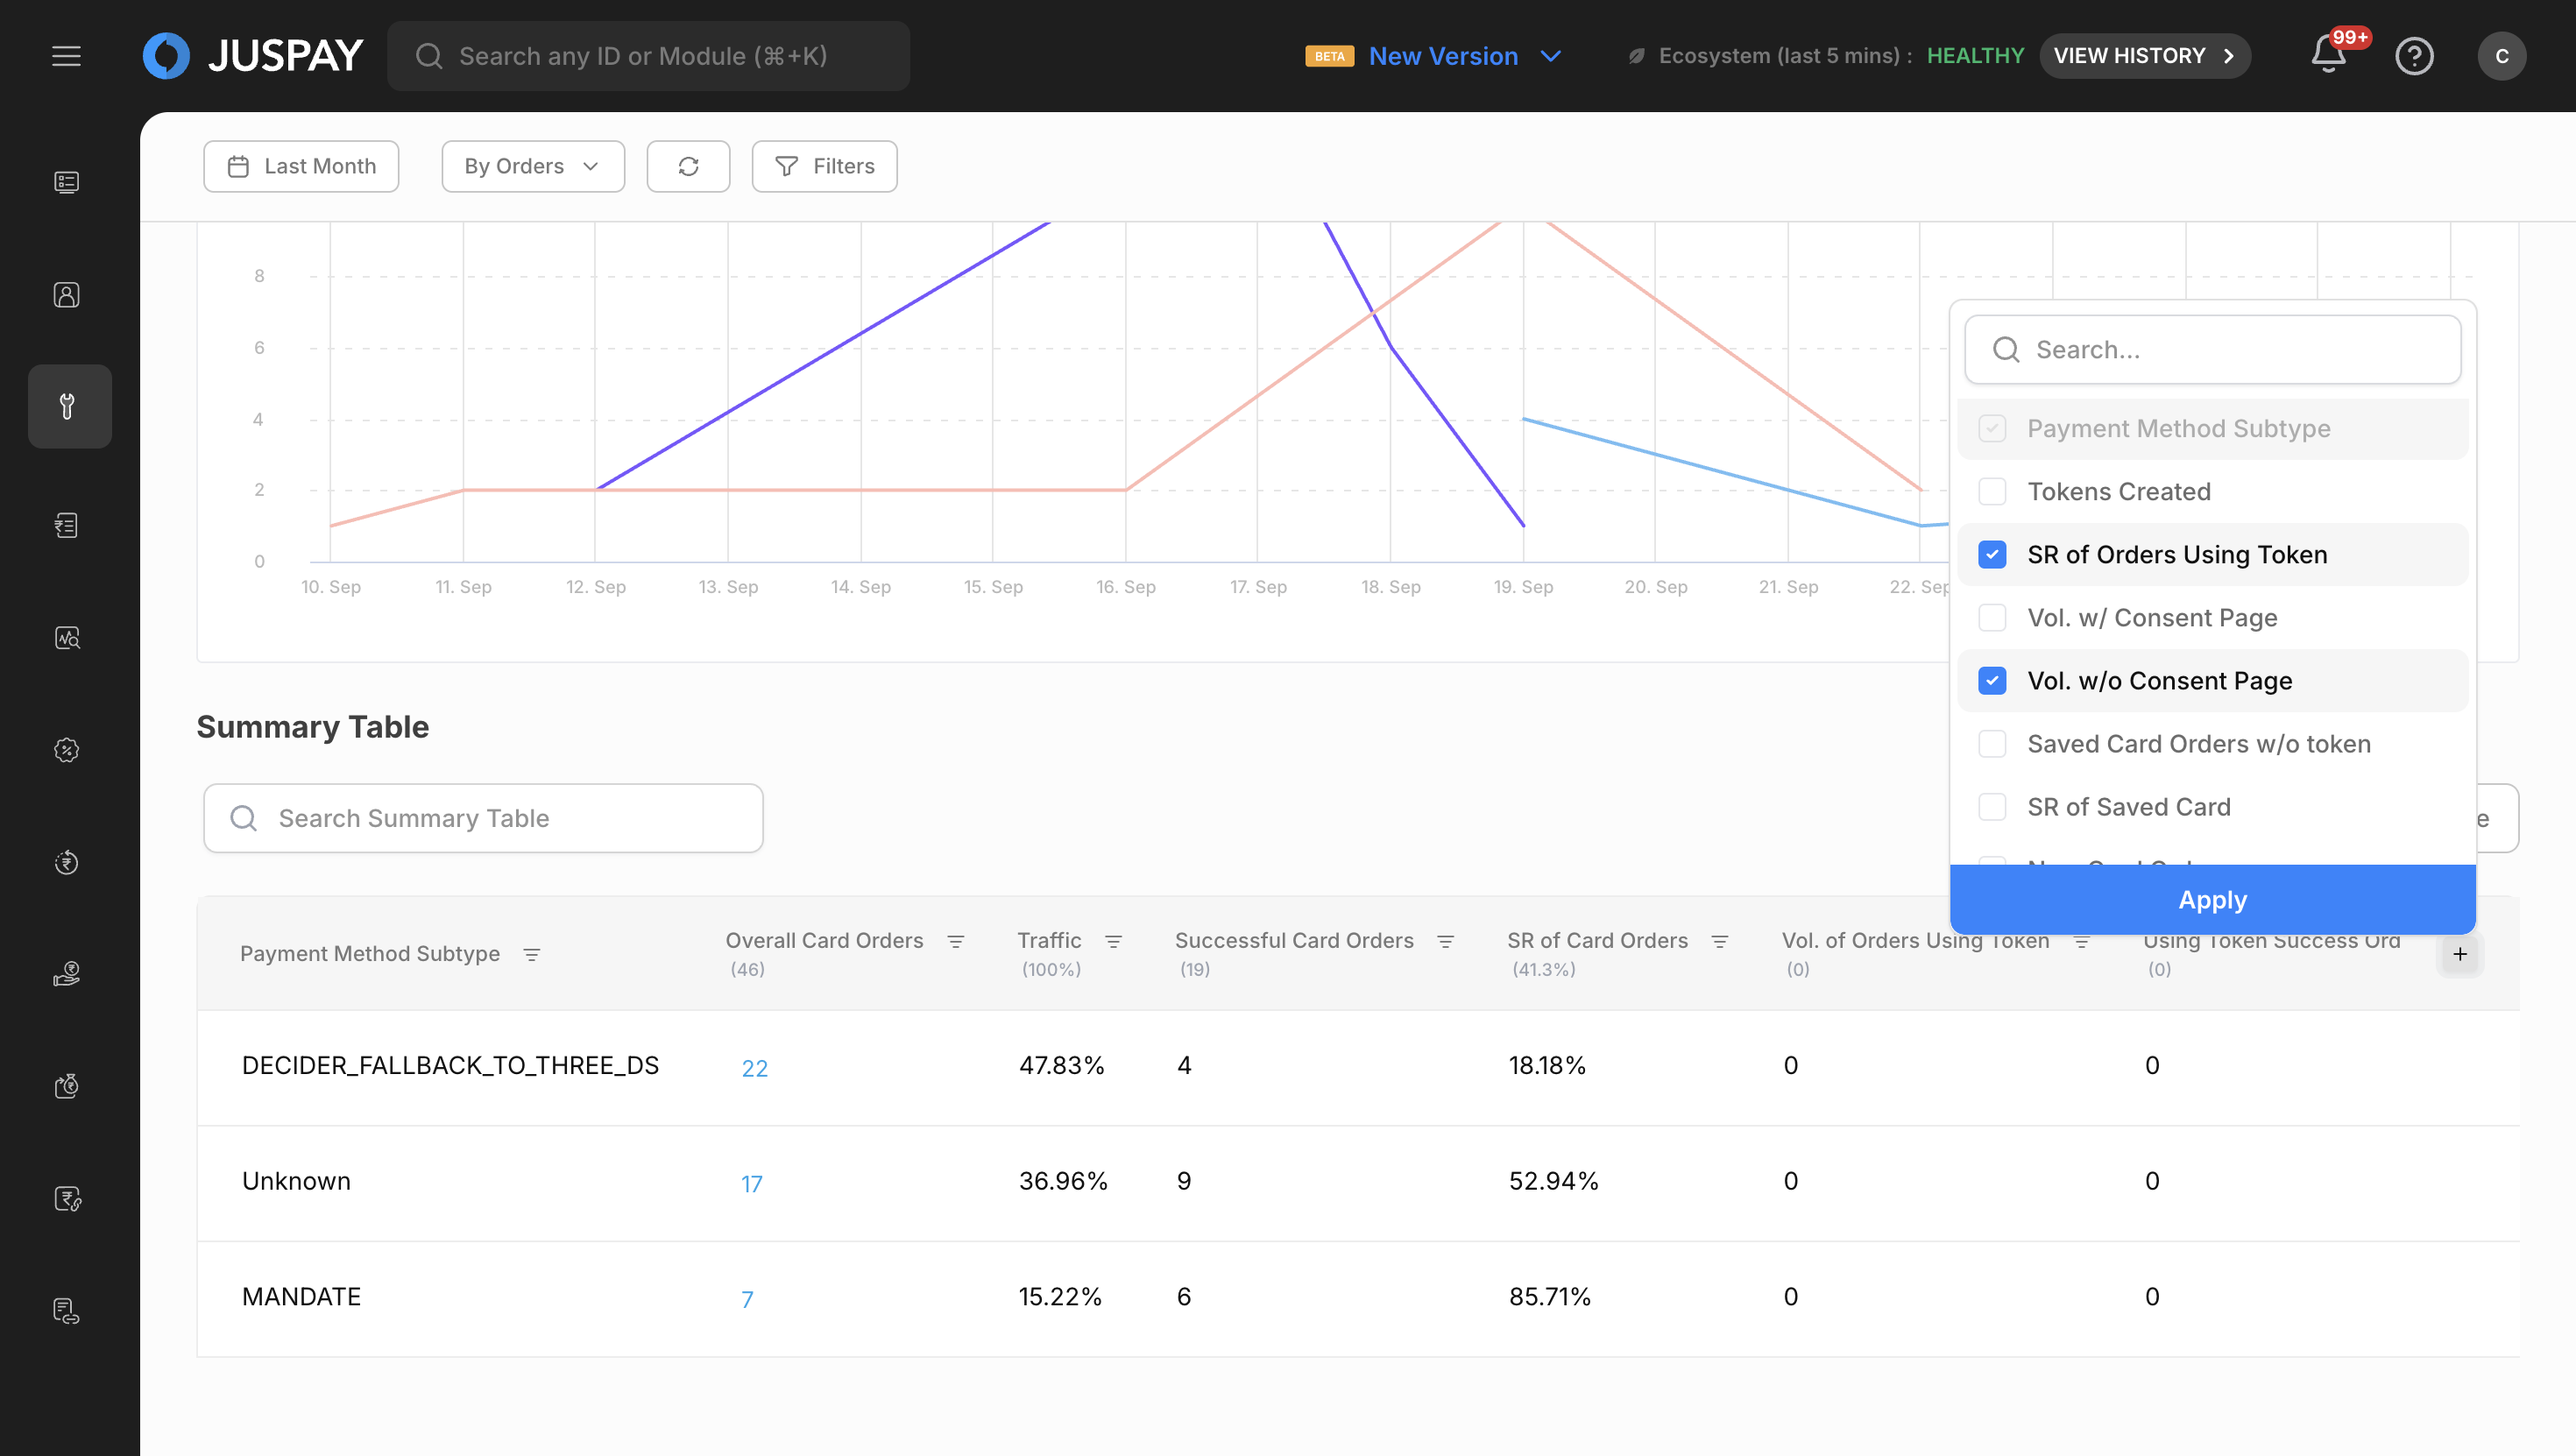
Analytics Table
Summary Tables
The analytics table provides comprehensive breakdowns of tokenization metrics across different segments:
Table Features
Sortable Columns: Click column headers to sort tokenization data
Pagination: Navigate through large datasets efficiently
Column Customization: Choose which columns to display
Export Functionality: Download table data in various formats
Advanced Sorting: Multi-column sorting capabilities
Column Selection: Choose specific columns to display
Root Filtering: Advanced filtering within table data
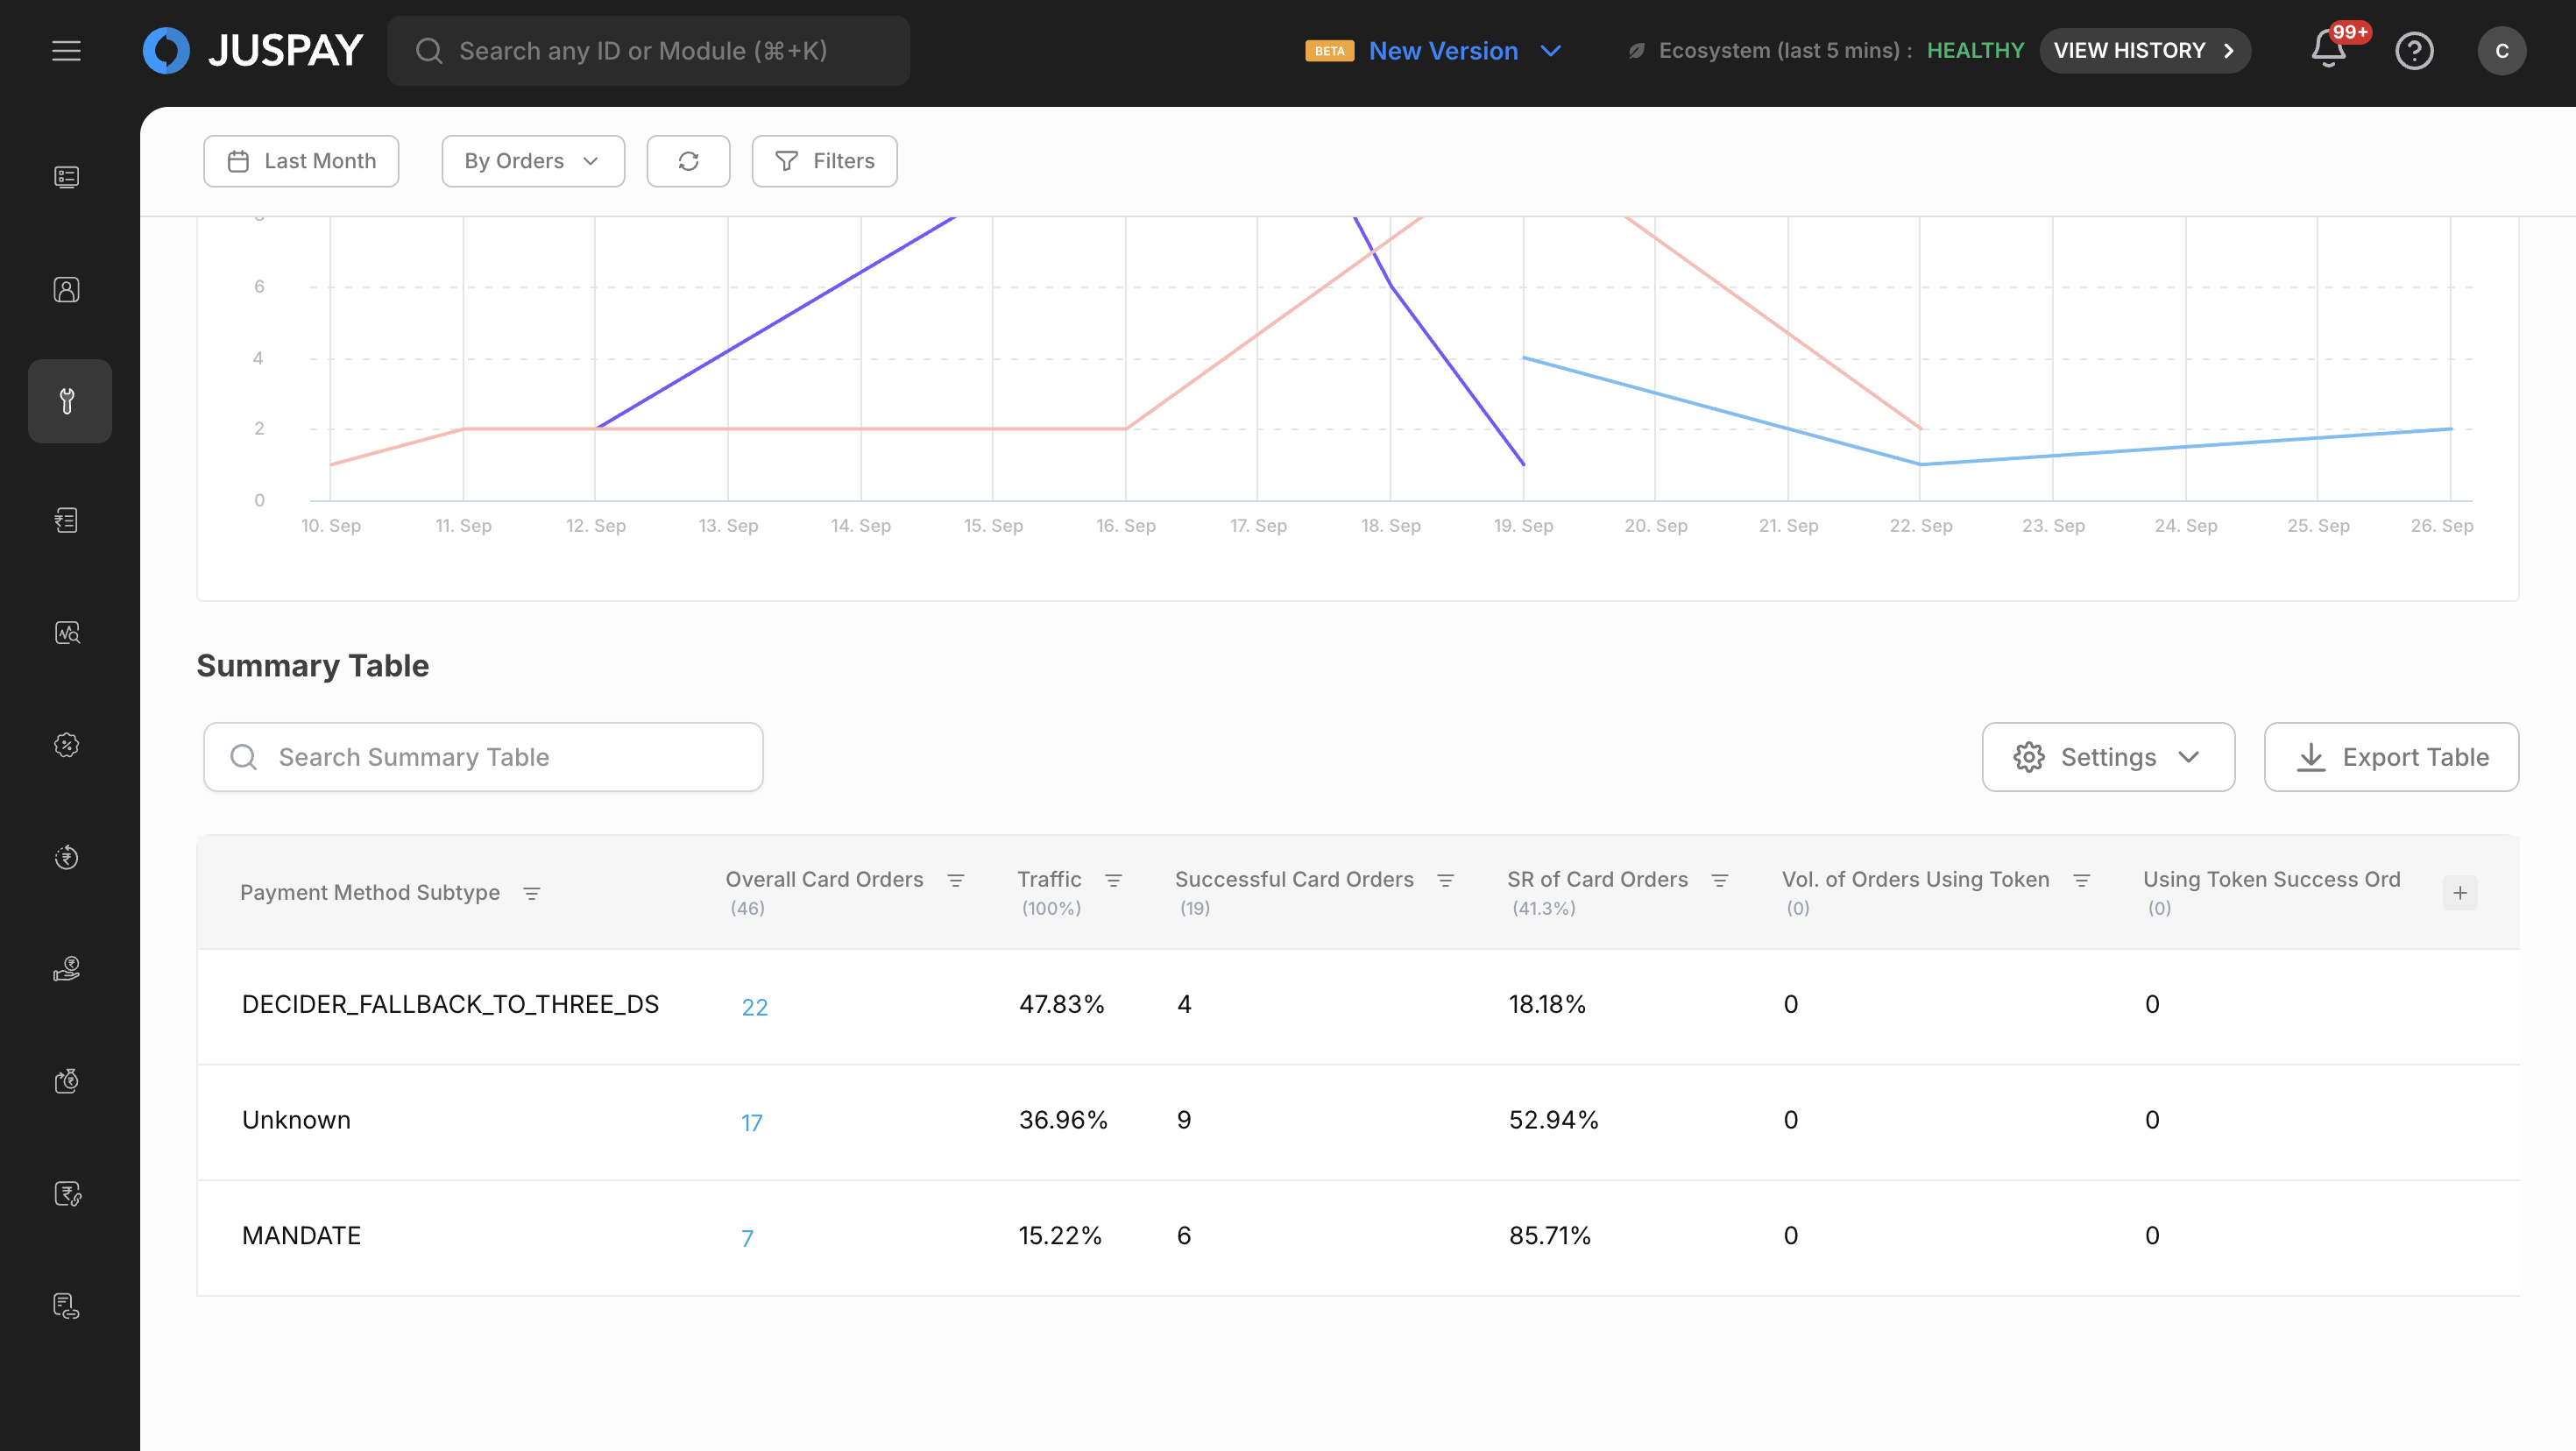
Table Actions and Interactions
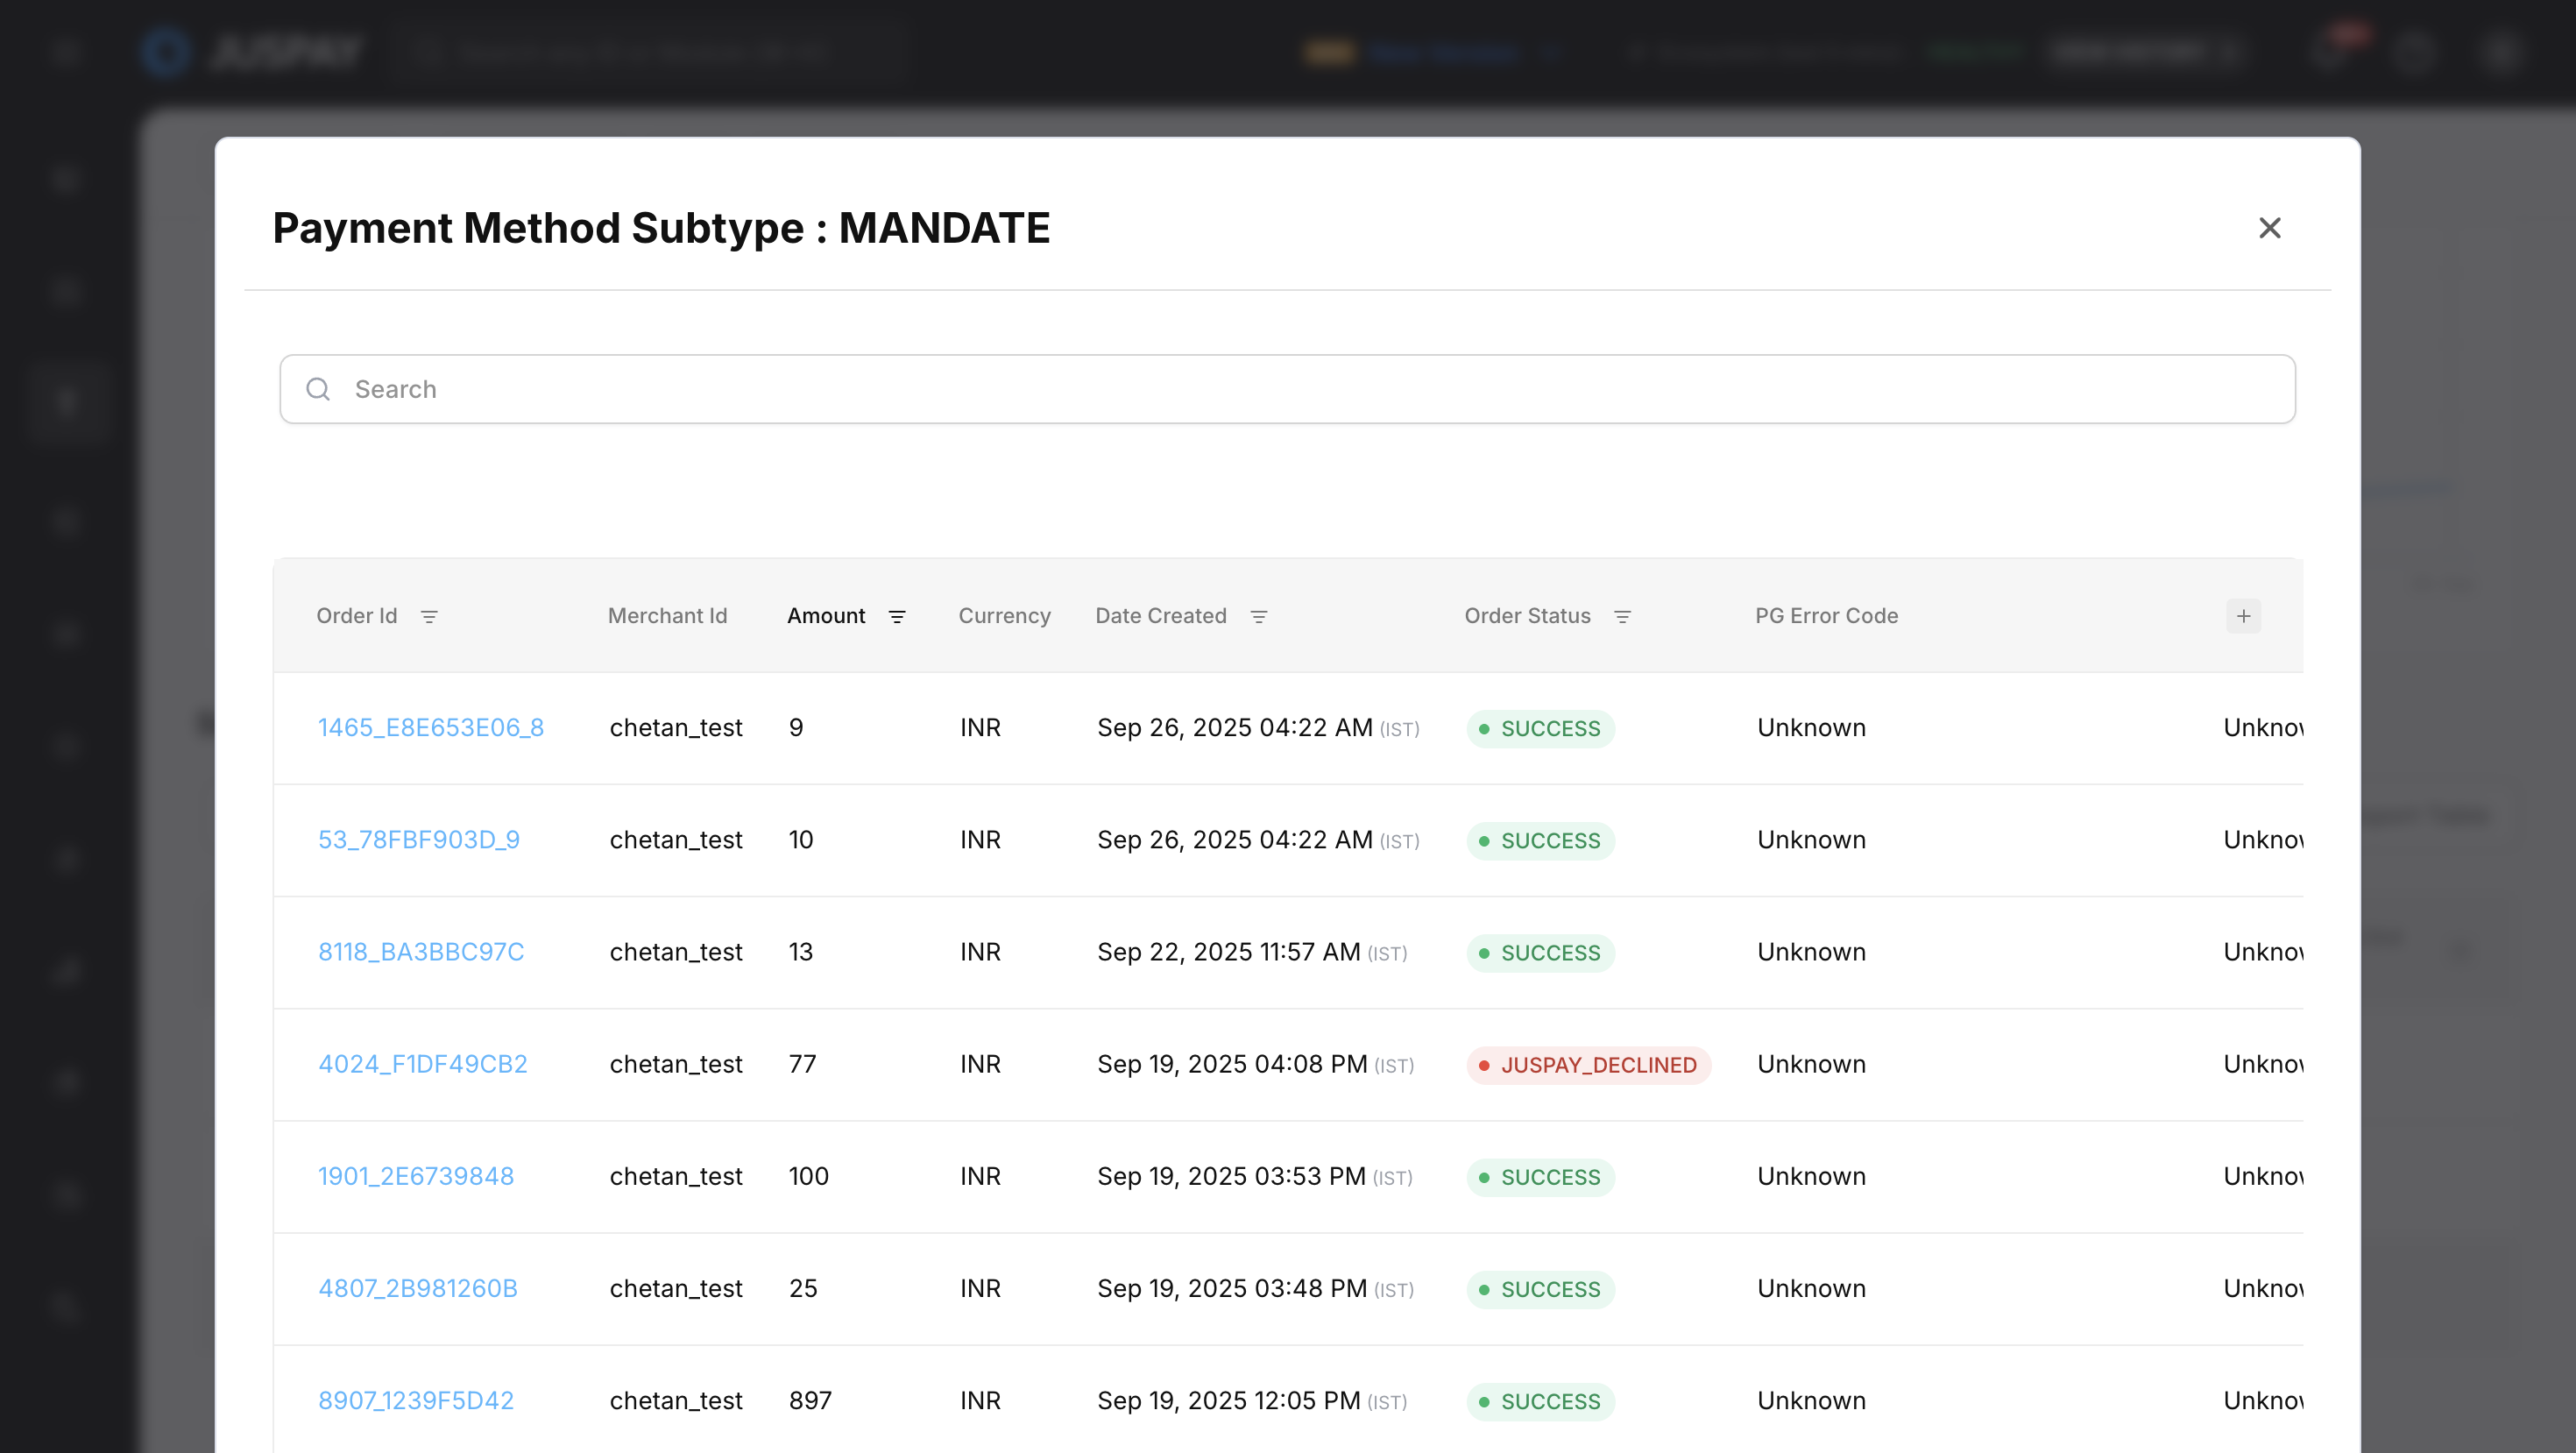
Volume Analysis
Click volume numbers to open detailed volume breakdown modals.
Analyze patterns using the detailed breakdown data.
Performance Metrics
Success Rates: View tokenization success rates with trend indicators
Processing Times: Monitor latency across different percentiles
Error Analysis: Detailed error distribution and patterns for tokenization operations
Table Customization
Column Management
Click the "Choose Columns" button.
Select/deselect columns to customize your tokenization data view.
Sync and Refresh
Manual Refresh
Sync Button
Purpose: Manually refresh all dashboard data
Usage: Click the "Sync" button to get the most current tokenization data
When to Use: When you need immediate data updates or suspect data staleness
Visual Feedback: Loading indicators show refresh progress
Data Export
Export Table Functionality
The tokenization analytics module provides a simple table export feature that downloads the currently visible table data.
How to Export
Apply Filters: Set your desired time range, mode, and segments to filter the data in the summary table.
Click "Export Table": Use the "Export Table" button located in the top-right corner of the Summary Table section.
Download: The system will immediately download a CSV file containing all the data currently displayed in the table.
Export Details
File Format: CSV (Comma Separated Values)
Data Included: All rows and columns currently visible in the Summary Table
Filename: Automatically generated with timestamp and applied filters
Content: Exports exactly what you see in the table - no additional field selection required
Use Cases
Real-Time Tokenization Health Monitoring
Set Transaction mode, last 1-6 hours time range
Monitor Success Rate and Error Rate metrics
Add payment_method_type segment
Tokenization Performance Analysis
Apply multiple segments for comparison
Compare Success Rate, Processing Times, Error Rates
Use charts for trend visualization
Export data for technical review
Monthly Business Impact Assessment
Set ORDER mode, previous month time range
Monitor Total Amount across currencies
Add currency segment
Use time comparison with previous month
Permissions and Roles
Access to the Tokenization Analytics module is controlled by the following permissions:
Tokenization Analytics Module Access: Required for accessing the tokenization analytics dashboard (ACL:
tokenization_analytics)Analytics Read Permission: Needed to view tokenization metrics and charts (ACL:
tokenization_analytics)Analytics Export Permission: Required for downloading tokenization data (ACL:
tokenization_analytics)
Feature Flag Requirements
The following feature flags must be enabled for full functionality:
txnAnalyticsReactQuery: Enables React Query implementation for improved performance and auto-refresh
autoRefreshEnabled: Enables auto-refresh functionality with configurable intervals
analytics.showMobileViewChange: Enables mobile view toggle between table and card layouts
showNewErrorRateTimeSeries: Enables specialized error rate time series charts
filterOperatorDropdownModules: Advanced filter operators (must include "Tokenization" module)
analyticsModules: Enables analytics modules functionality including tokenization analytics
mobileViewOptimization: Enables mobile view optimizations for tokenization analytics
exportFunctionality: Enables data export capabilities for tokenization data
segmentManagement: Enables dynamic segment loading and management
chartCustomization: Enables chart customization and mobile optimization features
- Have questions?
- Need help? Contact support
- LLM? Read llms.txt