















Payment cost observability is the ability to attribute, explain, and verify the full cost of accepting a payment. It connects payment attempts and settlements with interchange, network, provider, foreign-exchange, dispute, tax, and invoice data. The result tells a merchant what each payment cost, whether it was billed correctly, and what can be improved.
That sounds like a reporting problem. It is not.
A provider dashboard can show a fee. A settlement report can show a deduction. An invoice can show a monthly total. None of those sources, on its own, proves that the charge was expected, correctly classified, or economically sensible.
Cost observability builds that proof.
What is payment cost observability?
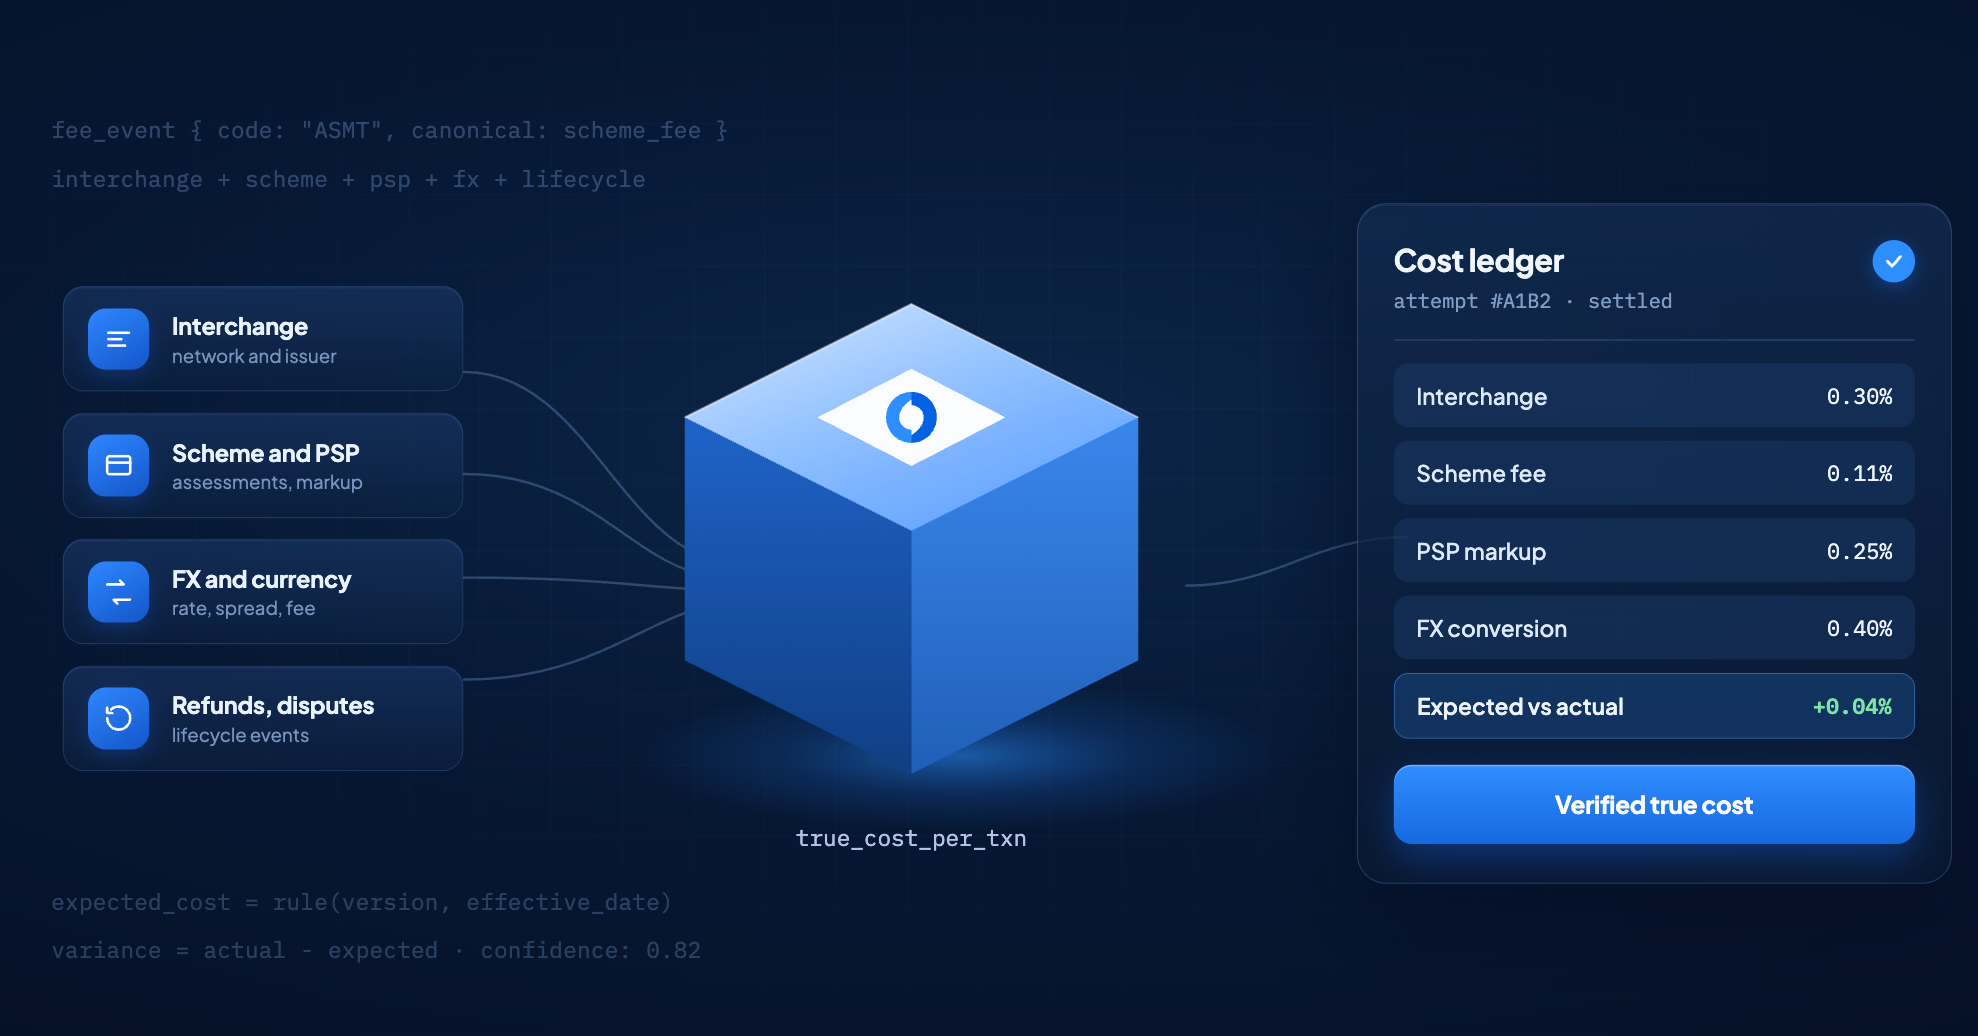
Payment cost observability explains the lineage of a cost from the payment attempt through settlement and invoicing. It preserves the source of each charge, compares actual fees with the applicable commercial terms, and records how confidently the cost can be assigned to a transaction, provider, market, or payment method.
The word “observability” matters. A report tells you what a system emitted. An observable system helps you reason backwards from an outcome.
For payment costs, that means answering questions such as:
- Why did this transaction cost more than a similar transaction?
- Which fee came from the network, issuer side, acquirer, PSP, FX conversion, fraud service, or a post-payment event?
- Did the provider apply the contracted rate and correct pricing tier?
- Does the settlement deduction reconcile with the invoice?
- Is a lower-cost route still lower-cost after declines, retries, disputes, FX, and settlement terms are considered?
- Which part of the apparent transaction cost was directly observed, and which part was allocated from a monthly charge?
How is payment cost observability different from reporting and reconciliation?
Reporting describes provider data, reconciliation establishes that operational and financial events agree, and cost observability explains whether the resulting charges are correct. The three capabilities share data, but they solve different control problems.
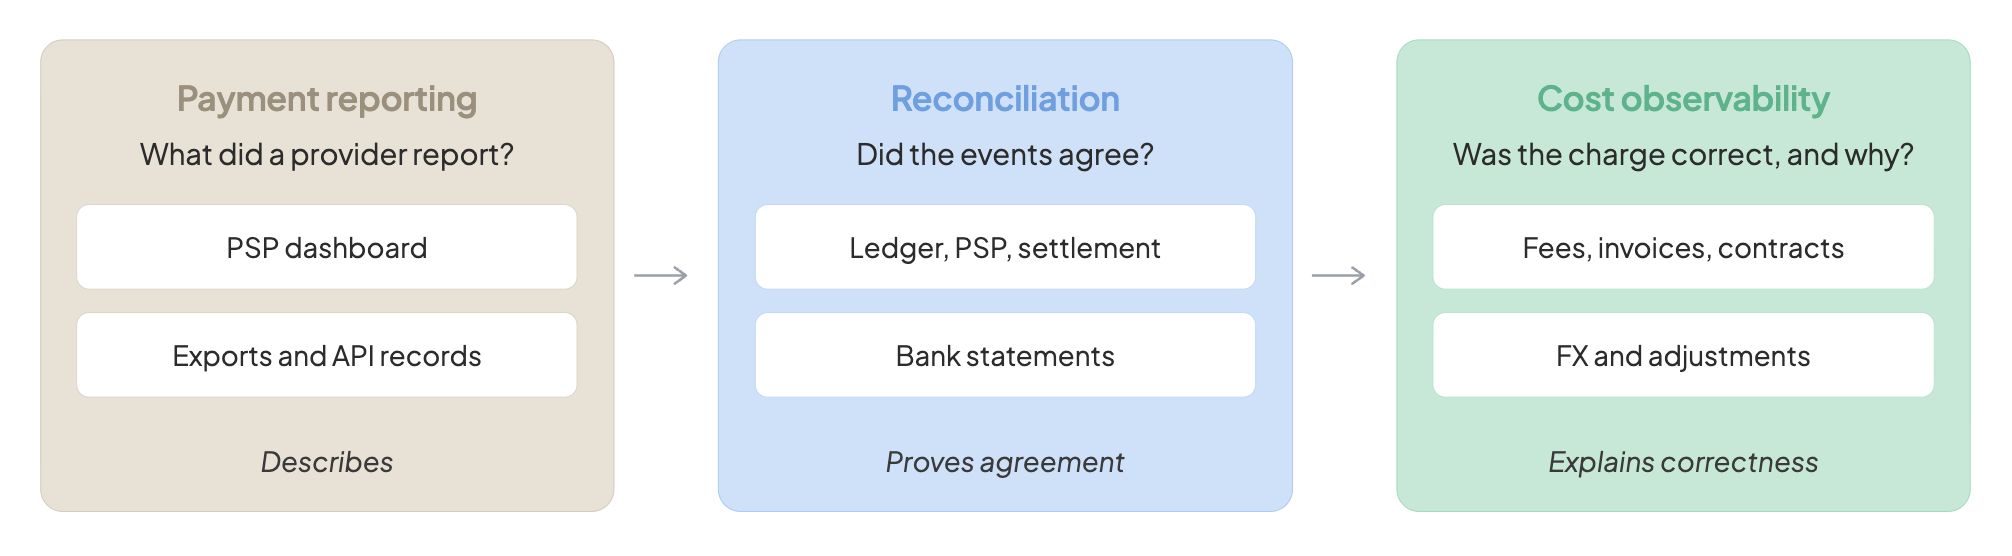
| Capability | Primary question | Typical evidence |
| Payment reporting | What did a provider report? | Payment service provider (PSP) dashboard, exports, API records |
| Payment reconciliation | Did orders, provider events, settlements, and bank credits match? | Merchant ledger, PSP data, settlement files, bank statements |
| Payment cost observability | What did the payment truly cost, was it expected, and why? | Reconciliation data plus fee records, invoices, contracts, FX data, adjustments, and allocations |
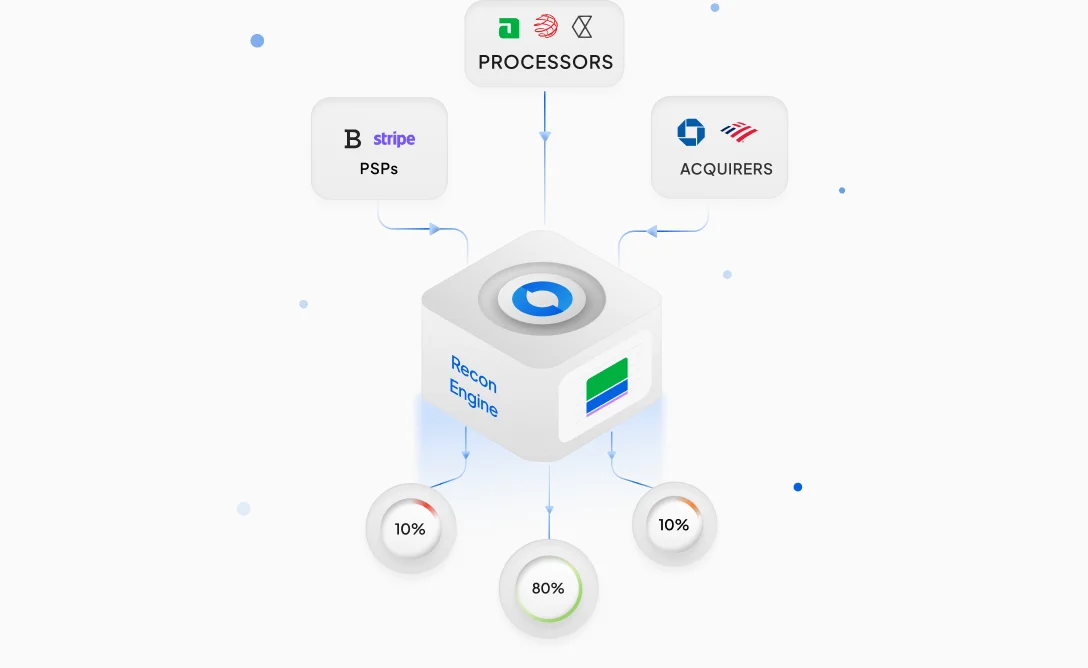
Reconciliation as an automated three-way comparison across merchant payment data, PSPs, and banks. Cost observability uses that financial lineage, then adds fee classification, expected-cost calculation, invoice audit, and decision support.
Why does the quoted processing rate not show the true cost?
A quoted transaction rate usually describes only one part of the cost of acceptance. The amount ultimately paid can also reflect interchange, network assessments, provider markup, currency conversion, authentication and risk services, post-payment events, taxes, fixed fees, minimum commitments, and later adjustments.
Card pricing is the ultimate example of this. What appears on a statement as a single deduction is actually a composite of volatile variables:
- Wholesale vs. Retail: Interchange is strictly a bank-to-bank transfer. The "merchant discount rate" you negotiate with your acquirer is a bundled retail markup. They are not the same thing.
- Dynamic Qualification: Interchange is a moving target. As Mastercard notes, your final rate shifts based on merchant category, settlement speed, data level, and biannual network updates.
- The Regulatory Illusion: While EU Regulation 2015/751 successfully capped EEA consumer interchange at 0.3%, it left scheme fees, FX markups, and processor surcharges entirely uncapped.
The practical lesson is simple: never use a single field called payment_fee if the underlying evidence contains several different economic events.
Which cost components should remain separate?
Keep every independently explainable fee as a separate record for as long as possible. Combining fee components too early makes invoice errors difficult to detect and turns provider comparisons into guesswork.
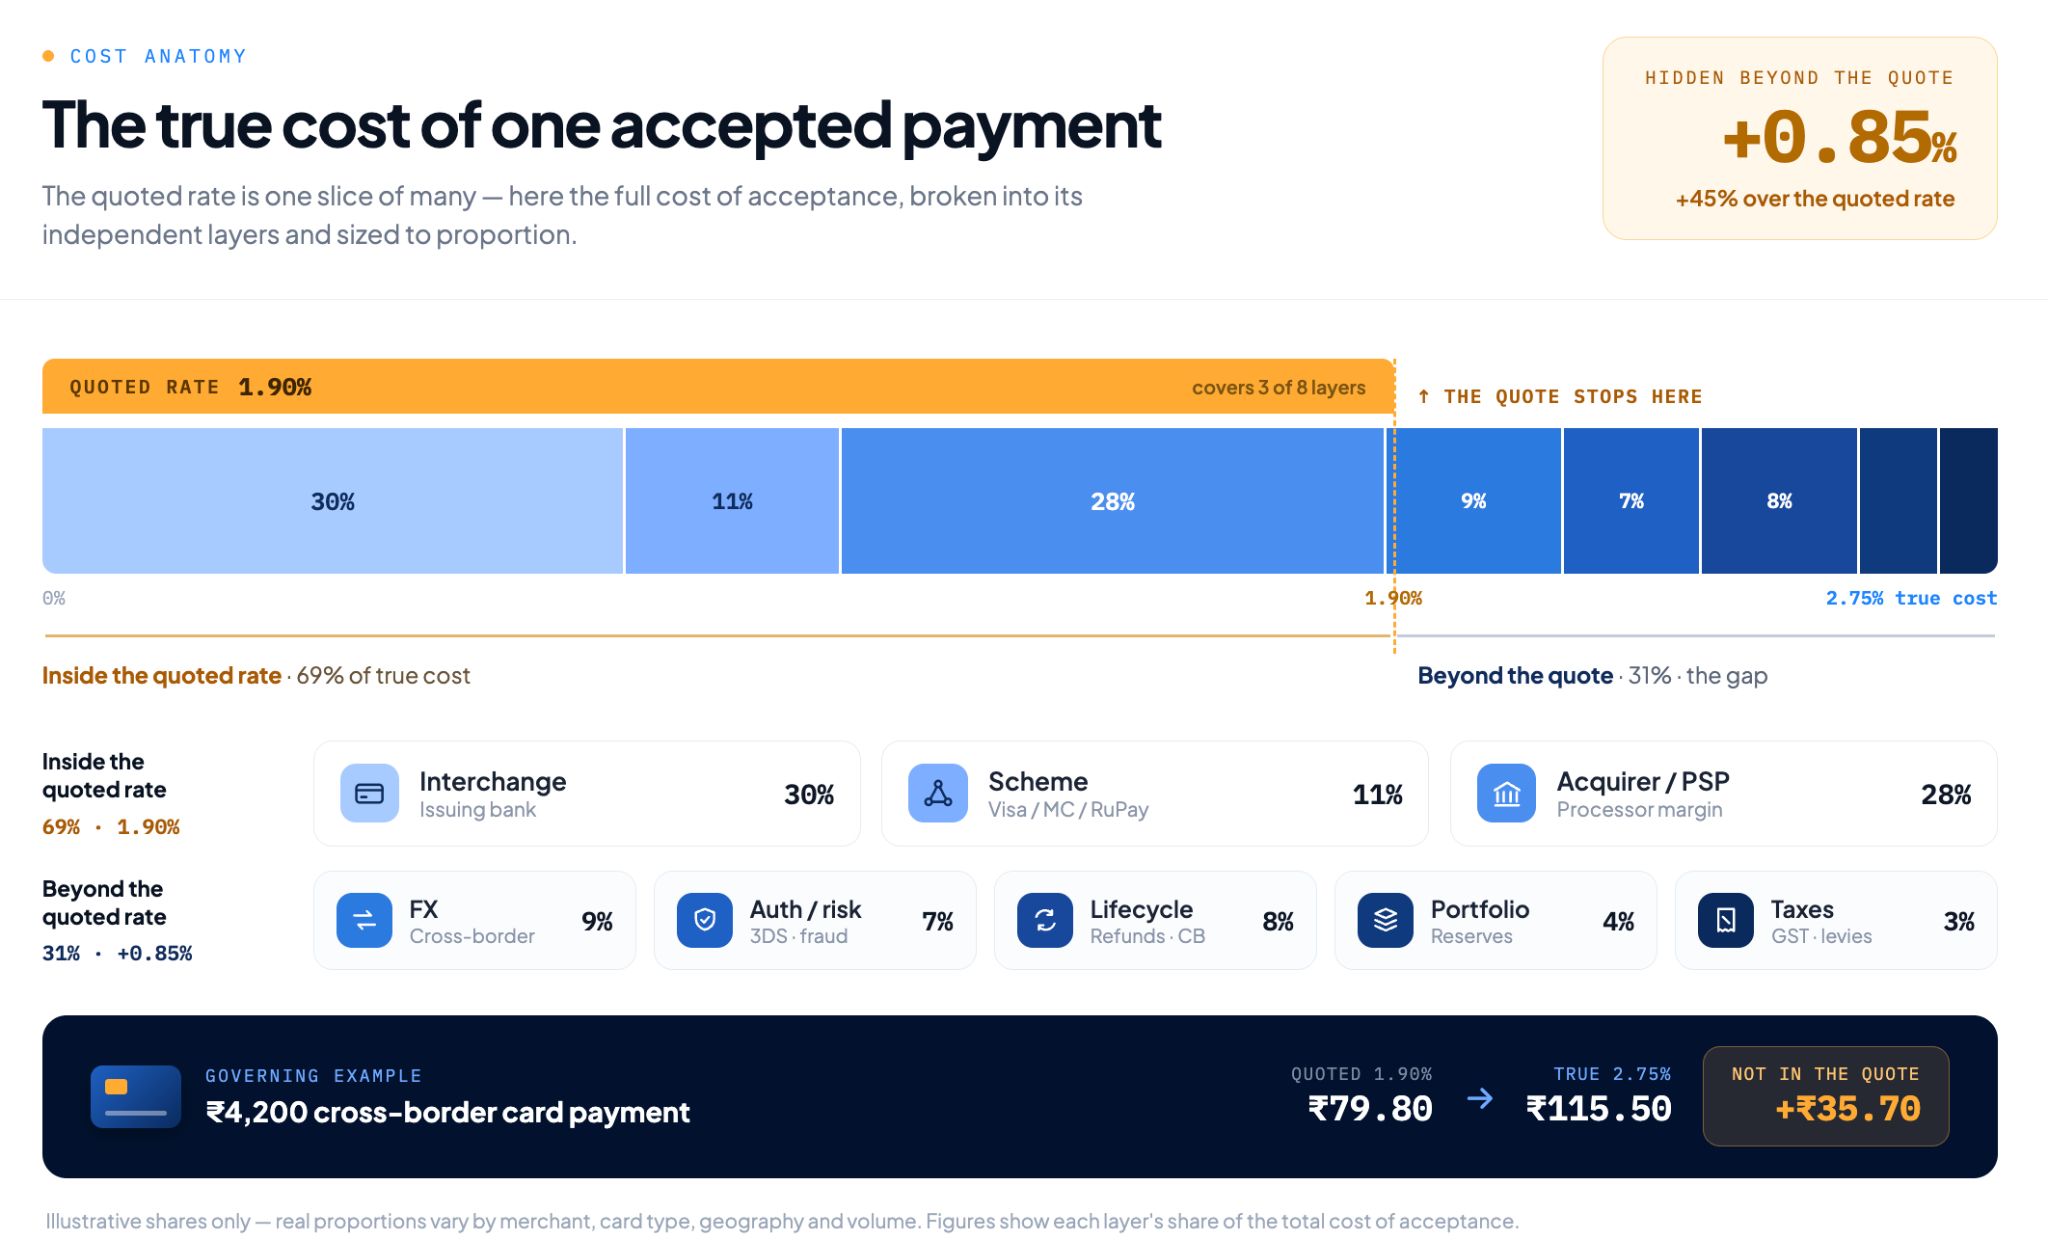
A useful cost taxonomy includes:
| Cost Layer | What It Covers (Examples) | Where to Find It (Typical Source) |
| Interchange | Fees paid to the customer's card-issuing bank (varies by debit, credit, commercial, domestic, or cross-border) | Transaction fee & settlement reports; network/acquirer data |
| Scheme / Network Fees | Fees paid to the card brands (assessments, processing, and network service fee codes) | Acquirer/PSP fee files & invoices |
| Acquirer / PSP Fees | Your processor's direct markup (fixed per-event fees, percentage/ad valorem markups, gateway charges) | Contracts, fee reports & invoices |
| FX & Currency Costs | Currency conversion charges (explicit conversion fees, observable exchange rate spreads, cross-currency charges) | Transaction, settlement, FX & invoice records |
| Authentication & Risk | Fraud and identity verification (3-D Secure / 3DS, fraud screening, risk-tool events) | Service-provider reports & invoices |
| Lifecycle Costs | Post-transaction event fees (refunds, chargebacks, reversals, dispute representments, retry charges) | PSP reports, dispute systems & invoices |
| Portfolio Charges | Account-level overhead (platform fees, monthly minimums, statement & customer support charges) | Contracts & invoices |
| Taxes & Adjustments | Post-billing reconciliations (taxes levied on fees, rebates, penalties, billing corrections) | Invoices, credit notes & settlement adjustments |
This framework does not assume that every provider supplies every field. Missing data is itself a useful signal: a gap should reduce the confidence score of the calculation, rather than letting the mystery cost disappear into an unexplained total.
How should FX cost be represented?
Tracking foreign exchange (FX) costs requires far more than just looking at the final converted payout. Suppose a customer pays in one currency, but your business settles in another. A common trap is simply subtracting your net settlement from the gross transaction amount and assuming the leftover gap is your FX cost. It isn't. That gap is a blended bucket that also hides interchange, network fees, provider markups, refunds, reserves, and taxes.
To truly isolate FX, a defensible record must capture three distinct layers:
- The Currencies: Transaction currency, settlement currency, and invoice currency.
- The Rates: The benchmark source rate (with timestamp) versus the applied rate used by the processor.
- The Charges: The converted amount, explicit conversion fee, and any observable markup.
Store each element separately. If a provider does not supply the benchmark source rate, explicitly flag it as missing. Never reverse-engineer an inferred spread yourself and present your math as an officially observed provider charge.
How do refunds, disputes, and failed attempts change cost?
Payment cost can continue changing long after authorisation. A refund, chargeback, reversal, or failed retry may generate a new charge, preserve an earlier charge, reverse part of a fee, or create a credit in a later billing period.
This is why the payment attempt is a better operational grain than the order. Grain here means the level of detail a record is stored at: one row per attempt rather than one row per order.
One order may produce an initial attempt, a technical retry, a fallback to another provider, a capture, a partial refund, and a later dispute. Flattening those events into one order-level fee hides which action produced the cost.
What is the formula for the true cost of a payment?
There is no useful universal cost number until its boundary and denominator are declared. A defensible model first totals direct, attributable fee events. It then presents allocated portfolio charges separately, subtracts applicable credits, and states whether taxes are included.
Use the following structure as a starting point:
The two totals should not be merged without labels.
An observed fee is supported by a transaction, settlement, or invoice record. An allocated fee is a modelled share of a charge that exists at another grain, such as a monthly platform fee. Both can matter to a commercial decision, but they are not the same kind of fact.
Broader total cost of ownership should remain another layer. Internal staffing, integration maintenance, fraud principal loss, working-capital effects, and revenue lost to declines are real economic considerations. Calling all of them “processing cost” makes the metric difficult to audit and harder to act on.
Which denominator should a merchant use?
Choose the denominator that matches the decision. Use settled volume for an effective cost rate, successful settled payments for unit economics, attempts for retry and routing analysis, and dispute cases for dispute-handling economics.
| Metric | Formula | Decision supported |
| Effective payment cost rate | Included payment costs / settled gross payment volume | Portfolio, market, and provider comparison |
| Cost per successful payment | Included payment costs / successful settled payments | Unit economics |
| Cost per attempt | Attempt-attributable costs / payment attempts | Retry and routing design |
| Invoice variance | Actual billed cost minus expected contractual cost | Billing audit |
| Cross-border cost share | Included cross-border-related cost / total included cost | Acquiring and currency strategy |
| Unexplained cost rate | Unmatched or unclassified cost / total included cost | Data-quality prioritisation |
What transaction-level data model is required?
The minimum viable model needs separate records for attempts, lifecycle events, settlements, fees, invoices, contract rules, FX observations, and allocations. These records should be linked through a canonical identity layer (single universal tracking ID) rather than flattened into one provider-specific table.
| Entity | Grain (Recorded Per) | What it Tracks (Essential Fields) | Core Purpose |
| payment_attempt | One attempt | Order ID, attempt ID, provider, merchant identifier (MID), method, card/network attributes, country, amount, currency, timestamps, authorisation result | Keeps retries and cascades visible |
| payment_event | One lifecycle event | Attempt ID, event type, time, amount, currency, provider reference | Models authorisation, capture, void, refund, reversal, dispute, and representment |
| settlement_line | One financial line | Provider reference or acquirer reference number (ARN) when available, batch, date, gross, deductions, net, currency | Connects payment activity with funds movement |
| fee_event | One fee assessment | Reference key, raw fee code, canonical category, amount, currency, date, source, direct or allocated flag | Preserves multiple fees and their lineage |
| provider_invoice_line | One invoice line or aggregate | Invoice, period, account, raw label, count or volume basis, rate, amount, currency, tax | Captures billing-period charges |
| contract_rate_rule | One versioned commercial rule | Provider, effective dates, market, payment attributes, event, fixed or variable rate, tier, exceptions | Calculates expected cost |
| fx_observation | One conversion fact | Source, timestamp, currency pair, source rate, applied rate, converted amounts, explicit fee | Makes FX treatment explainable |
| allocation_record | One allocated charge | Source invoice line, allocation rule, target cohort or transaction, amount, version | Separates modelled cost from observed cost |
| cost_variance | One comparison result | Expected amount, actual amount, difference, reason, confidence, owner, status | Supports audit and resolution |
Two design choices make this model trustworthy.
1. Keep the processor's original fee description alongside your standardized category. Different payment providers might use vague billing codes or terms like "Assessment" and "Network Service" for the exact same type of fee. While it is helpful to group these items under one clean category for internal reporting, you must always save the processor's exact original label. If your business ever faces an audit or needs to dispute a billing discrepancy, you will need that raw provider code as your proof.
2. Track all commercial pricing rules by date. Contract rates do not stay static. A processor might update their rate card mid-year, your transaction volume might unlock a lower pricing tier, or a special fee exception might apply to just one regional market. To calculate what a payment should have cost, your system must apply the exact contract rule that was active on the day the transaction occurred.
How the Cost Observability Pipeline Works: Step-by-Step
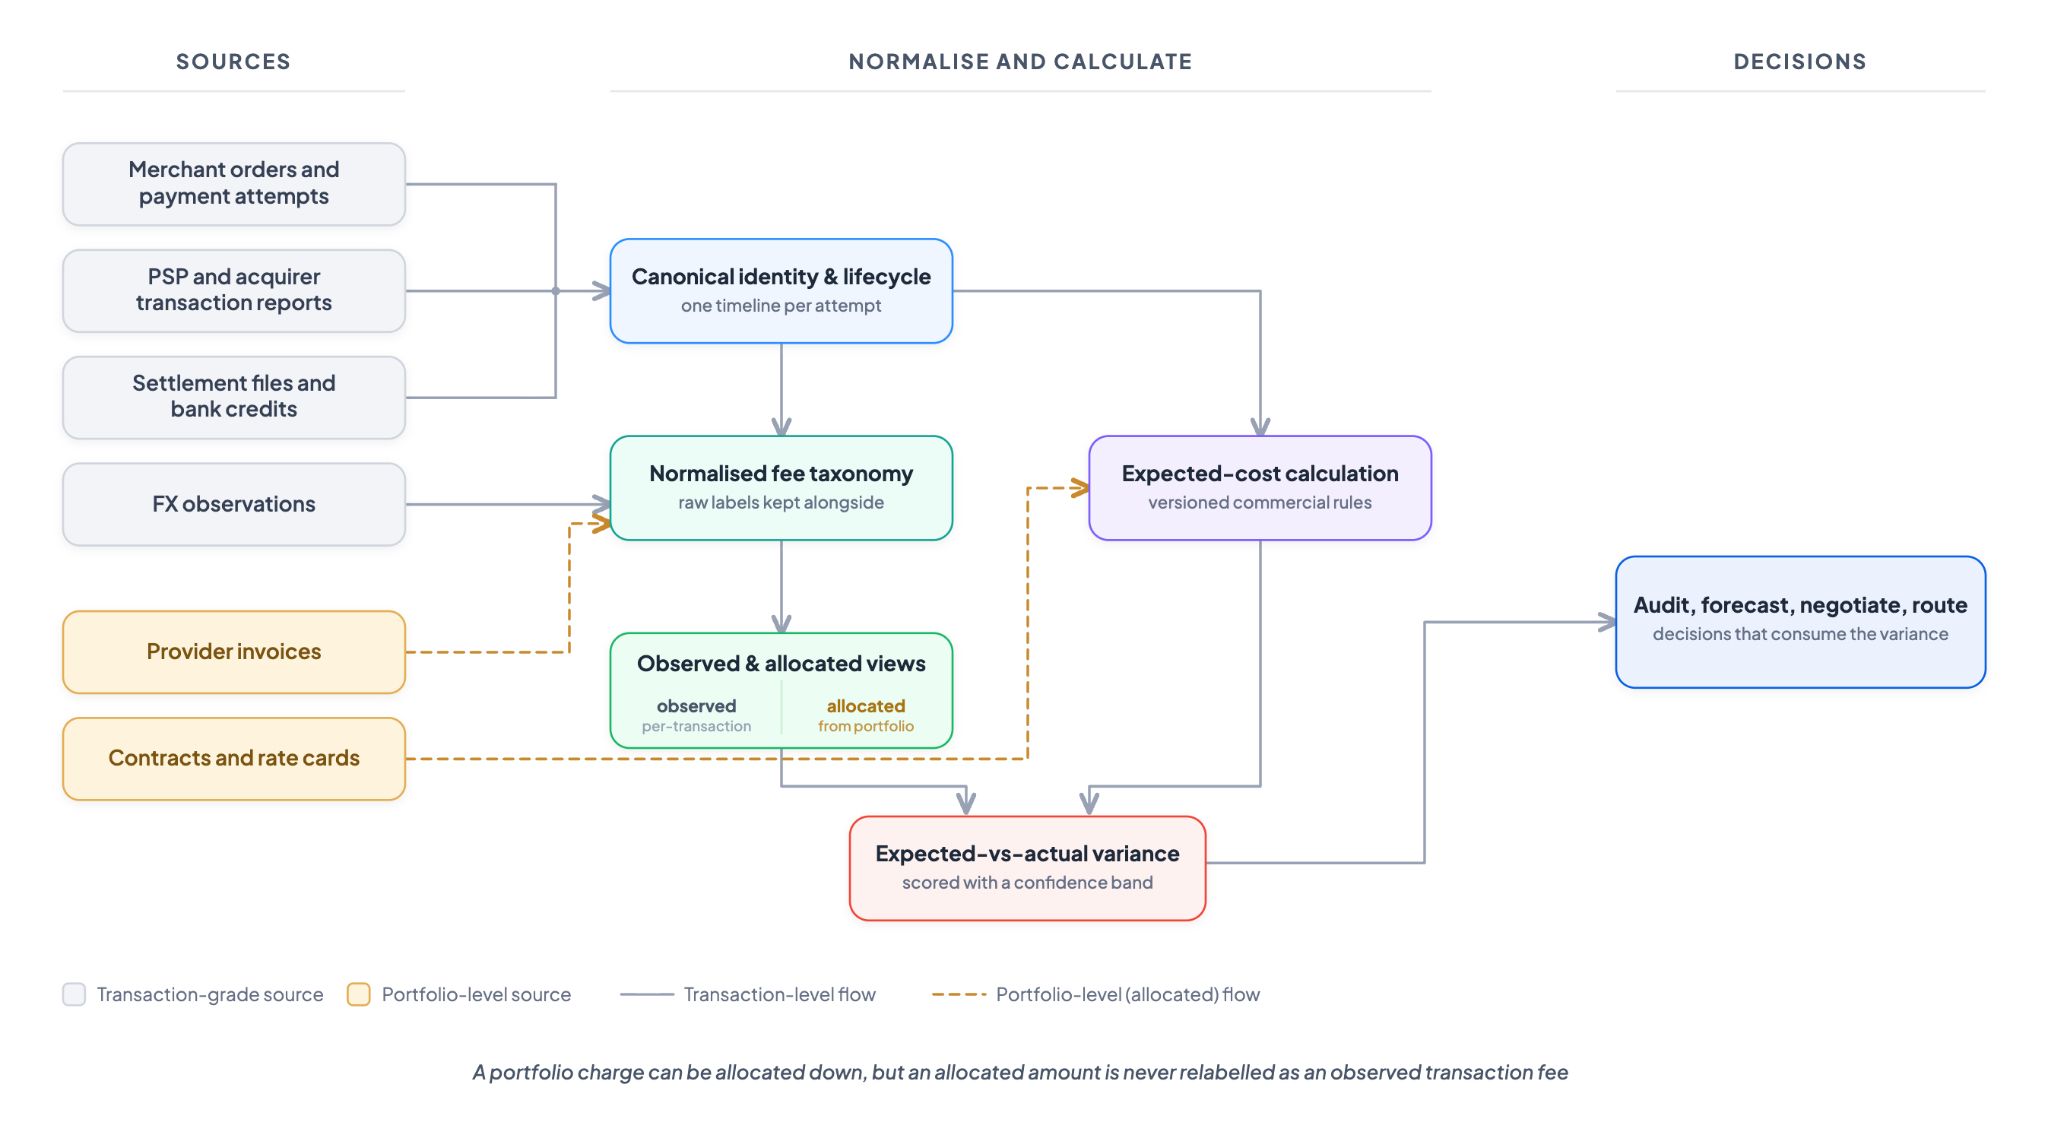
This diagram maps out how raw, fragmented payment data is transformed into actionable financial intelligence. The architecture is broken into three distinct stages:
1. Sources: Gathering the Evidence
The pipeline begins by ingesting two fundamentally different types of data:
- Transaction-Grade Sources: Live, itemized data tied to specific timestamps. This includes your internal merchant orders and payment attempts, external PSP and acquirer transaction reports, actual settlement files and bank credits, and live market FX observations.
- Portfolio-Level Sources: High-level, lump-sum billing documents. This covers aggregate provider invoices and your legal agreements (contracts and rate cards).
2. Normalise and Calculate: The Core Engine
Once ingested, the raw data flows through five interconnected processing layers:
- Canonical Identity & Lifecycle: Instead of keeping separate tables for checkouts, processor authorizations, and bank deposits, the system stitches them together into one timeline per attempt.
- Normalised Fee Taxonomy: Confusing vendor billing codes are translated into a standardized internal format, while ensuring raw labels are kept alongside for audit proof.
- Observed & Allocated Views: The system separates hard, directly observed per-transaction fees from overhead platform charges allocated from the portfolio.
- Expected-Cost Calculation: The system reads your signed contracts and applies versioned commercial rules to calculate the exact theoretical fee your processor should have charged for that specific transaction.
- Expected-vs-Actual Variance: The theoretical cost is compared against the actual billed cost. Any gap is flagged as a billing discrepancy and scored with a confidence band (accounting for missing data or exchange rate timing).
3. Decisions: Putting the Data to Work
The final variance score gives finance, product, and data teams the auditable proof required to drive four critical business actions:
- Audit: Automatically flag vendor overcharges and submit line-item dispute claims to your PSP.
- Forecast: Predict future payment overhead with high precision based on actual historical margins.
- Negotiate: Enter vendor contract renewals backed by hard data on hidden markups and FX spreads.
- Route: Program checkout engines to dynamically route transactions to the most cost-effective processor for specific card networks or regions.
How do you match transactions, settlements, and invoices?
Cost matching requires a hierarchy of identifiers and controlled fallbacks. Start with stable merchant and provider references. Then use capture references, ARN where available, settlement batch, MID, event dates, amounts, and currencies. Retain the method and confidence of every match.
A practical workflow is:
- Ingest raw source data unchanged. Preserve filenames, reporting periods, original labels, amounts, currencies, and provider totals.
- Normalise events and fee codes. Map provider-specific terms to a canonical taxonomy while keeping the raw values.
- Resolve payment identities. Link orders, attempts, provider transactions, captures, refunds, disputes, and settlement records.
- Match direct fee records. Attach transaction-level fees only when the evidence supports the relationship.
- Reconcile settlement lines. Explain gross amount, deductions, net amount, and bank credit at the correct lifecycle stage.
- Reconcile invoice totals. Match detailed lines where possible, then match aggregate charges to defined cohorts such as one MID, fee code, network, or billing period. A cohort here is simply a defined group of transactions that share a property.
- Calculate expected cost. Apply the versioned commercial rule to the eligible transaction or cohort.
- Classify differences. Separate timing, missing data, rule exceptions, allocation effects, taxes, and potential billing variance.
- Leave residuals visible. An unresolved difference is more useful than a forced match that looks complete.
Aggregated charges deserve particular care. If an invoice contains one monthly scheme-fee total, the system can reconcile that total to a cohort. Allocating it to individual transactions is a separate analytical operation. Store the allocation basis and model version so that finance can reproduce the result.
How can merchants detect fee errors?
A payment fee audit compares the charge expected under the applicable commercial rule with the amount reported, deducted, or invoiced. A useful variance record identifies the affected events, rule version, source evidence, reason category, confidence, financial value, owner, and resolution status.
Common variance categories include:
- Incorrect fixed or percentage rate
- Wrong volume tier or threshold
- Unexpected or unmapped fee code
- Duplicate charge
- Missing rebate or credit
- Domestic, cross-border, card, or transaction classification difference
- FX source, timestamp, or conversion discrepancy
- Tax treatment
- Billing-period timing difference
- Missing source data
Do not label every difference as an overcharge. A variance can arise because the transaction was classified differently under network rules, because a credit appears in the next period, or because the contract model omitted an exception. The audit workflow should support investigation before recovery.
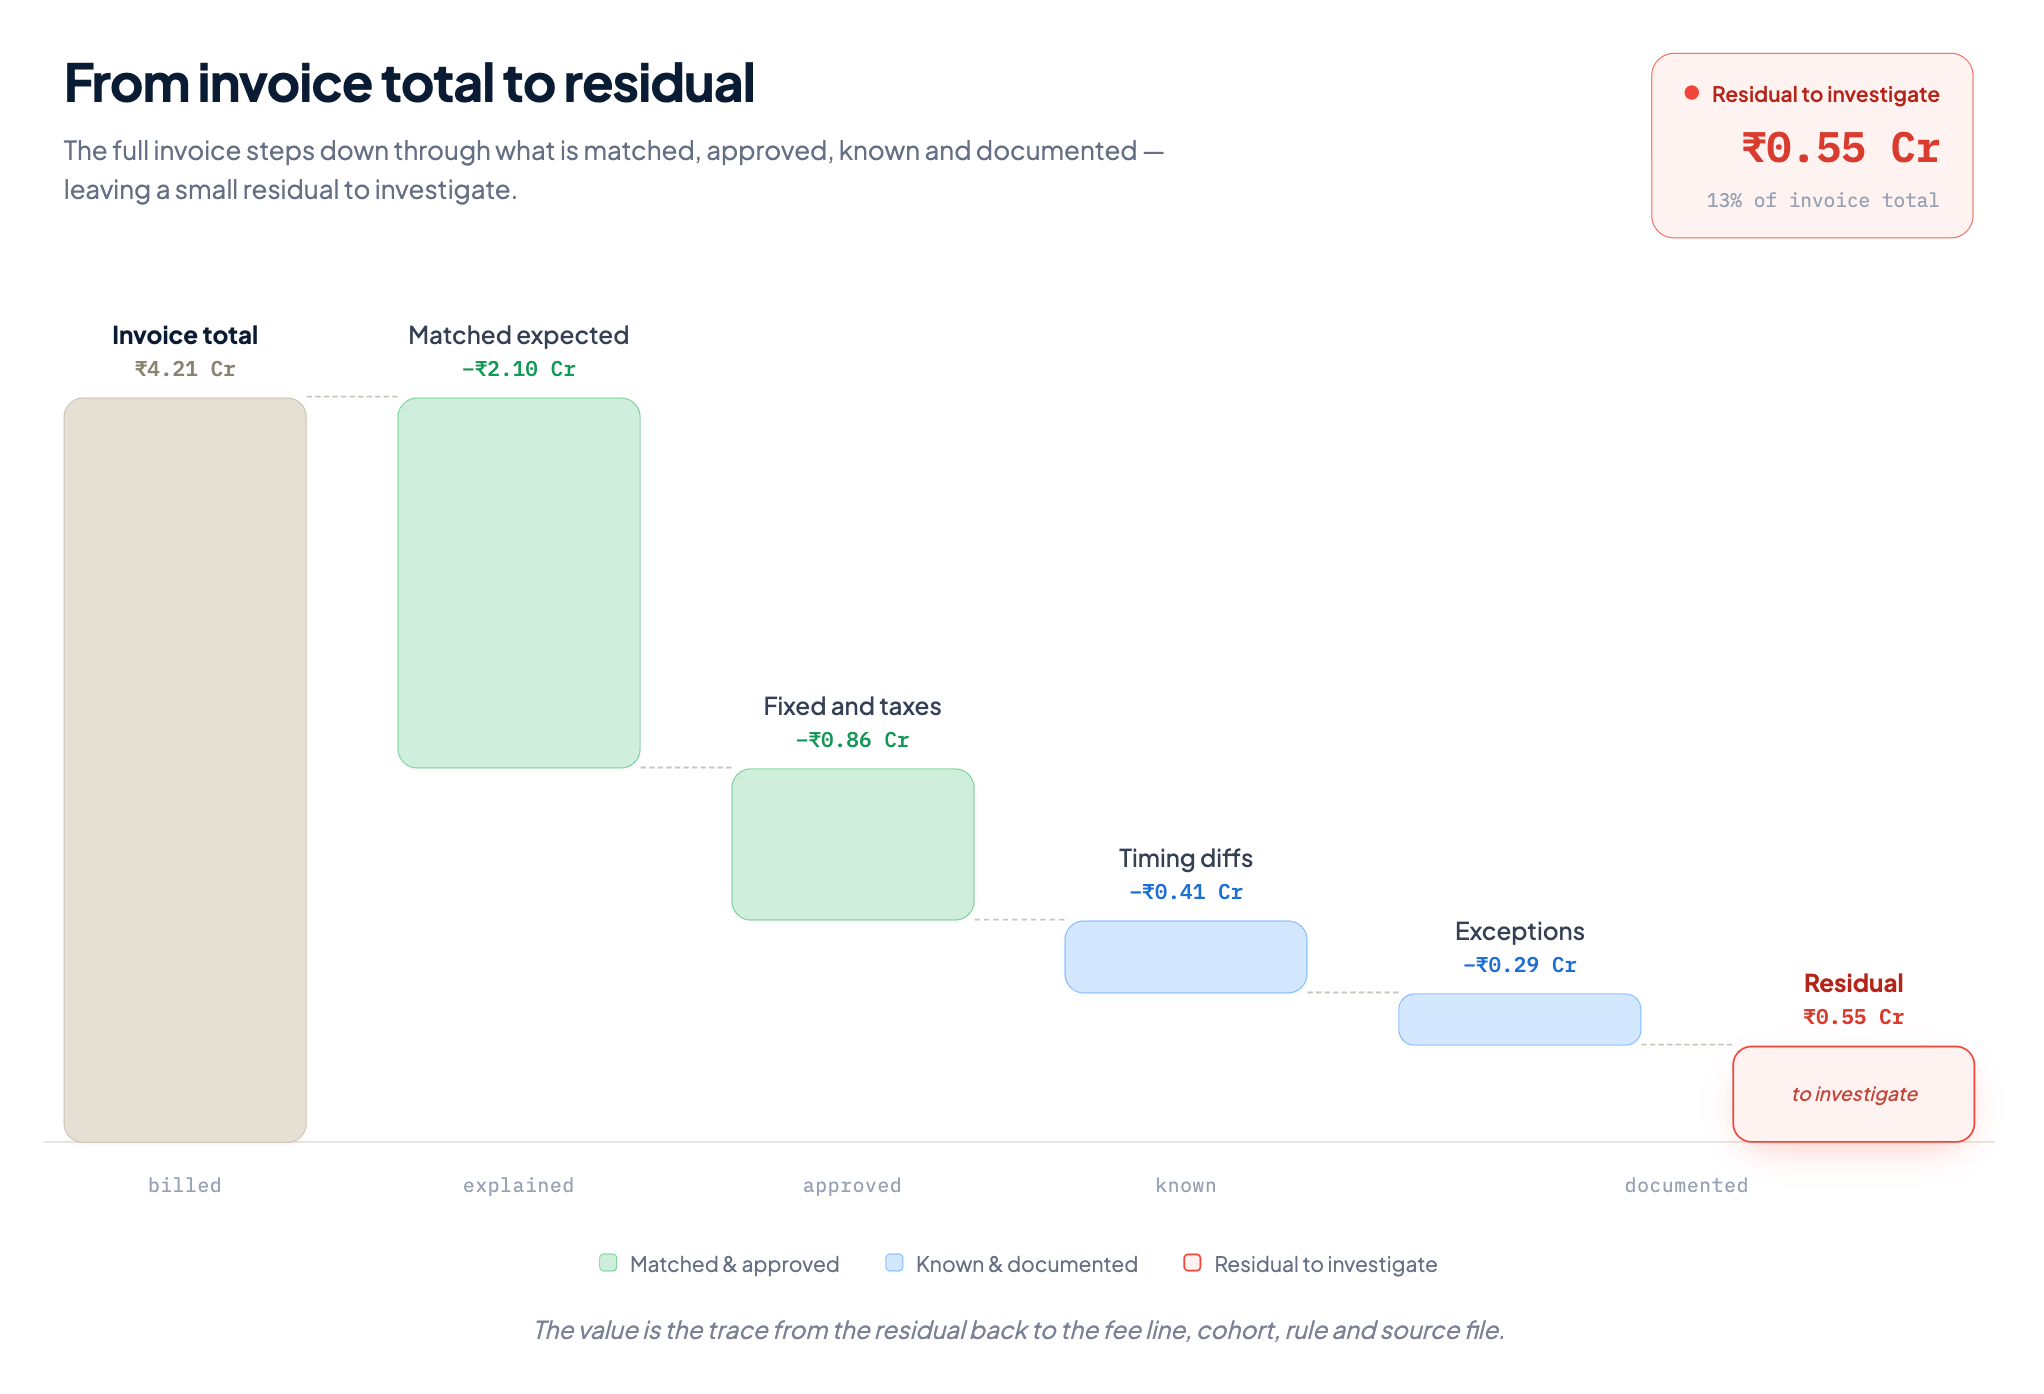
The most valuable output is not the chart. It is the trace from a residual back to the exact fee line, transaction cohort, commercial rule, and source file.
How should merchants compare costs across PSPs and markets?
Compare providers using like-for-like cohorts and weighted metrics. A raw average can make one PSP appear cheaper simply because it receives domestic debit traffic while another receives cross-border commercial cards, retries, higher-risk transactions, or a different currency mix.
Useful cohort dimensions include:
- Merchant entity and MID
- Market and issuer country
- Transaction and settlement currency
- Payment method, network, and card product
- Domestic or cross-border classification
- Channel and authentication status
- Amount band
- Initial attempt or retry
- Authorisation, capture, refund, or dispute outcome
Cost also needs a performance companion. A route with a lower expected fee may approve fewer valid transactions, fail more often, settle later, or generate more retries. The correct business comparison is not “fee A versus fee B.” It is the economic outcome for a comparable set of payment attempts.
How does cost observability reduce processing costs?
Cost observability does not reduce fees by itself. It produces verified inputs that can support billing recovery, contract negotiation, provider-mix changes, local acquiring, better transaction data, service rationalisation, and cost-aware routing.
The operating loop has four stages:
- Observe: Build a normalised view of actual, expected, settled, invoiced, and allocated costs.
- Explain: Identify what caused a fee or variance and how confident the explanation is.
- Act: Recover a billing error, renegotiate a term, change provider configuration, or adjust routing policy.
- Measure: Verify whether the action changed total cost and whether it affected acceptance, fraud, reliability, or settlement.
Cost-based routing belongs in the third stage. It should evaluate the expected all-in cost of eligible routes while enforcing merchant-defined constraints for authorisation performance, reliability, latency, risk, and commercial commitments.
What should a payment cost dashboard show?
A useful cost dashboard shows lineage, confidence, and actionability rather than a single blended total. It should display actual and expected cost, variance, unmatched residuals, allocation assumptions, controlled benchmarks, and the owner of each unresolved issue.
Different teams need different views of the same canonical model:
| Team | Questions the dashboard should answer |
| Finance and controllership | Did billed fees match contracts? What remains unexplained? |
| Treasury | What settled, in which currency, when, and after which deductions? |
| Payments and product | Which routes or methods have avoidable cost without an unacceptable performance tradeoff? |
| Risk and fraud | What do authentication, screening, disputes, and chargebacks add to acceptance cost? |
| Procurement | How do providers compare on normalised cost and service outcomes? |
| Engineering and data | Which feeds, mappings, joins, or identifiers create low-confidence results? |
Always display a confidence score next to every financial total. If a dashboard contains significant unexplained costs, it should not look just as complete and authoritative as a dashboard where every single fee is backed by a clear audit trail. The goal is simple: show your data coverage honestly.
How can a merchant implement payment cost observability?
Start with one provider, one merchant account, and one closed billing period. Prove invoice-to-transaction lineage before expanding. A narrow, audit-ready implementation is more valuable than a broad dashboard built on opaque assumptions.
The implementation sequence should be:
1. Define direct cost, allocated cost, TCO, denominators, and tax treatment.
2. Inventory payment, settlement, invoice, contract, FX, dispute, and bank sources.
3. Select a representative provider, MID, market, and completed billing period.
4. Build the identity map and canonical fee taxonomy.
5. Reconcile the invoice total before allocating charges to transactions.
6. Encode the applicable contract and rate rules with effective dates.
7. Calculate expected cost and review residuals with finance and payments teams.
8. Add like-for-like provider and market comparisons.
9. Connect approved insights to dispute, negotiation, provider, and routing workflows.
10. Expand to more providers while preserving raw evidence and lineage.
When evaluating a platform, ask whether it:
- Preserves raw fee labels and source records
- Separates observed and allocated cost
- Supports versioned contract rules and pricing tiers
- Handles multiple fee and settlement currencies
- Reconciles aggregate invoices without forcing transaction matches
- Exposes match method, confidence, and residuals
- Models retries, refunds, reversals, and disputes as lifecycle events
- Compares providers using controlled cohorts
- Connects insight to actions with authorisation and reliability guardrails
- Supports a review and dispute workflow rather than producing alerts alone
Where does Juspay fit in the cost operating loop?
True payment optimization requires a closed loop: observability to diagnose the cost leak, and orchestration to immediately fix it. Juspay bridges this exact gap. By uniting integrations across 300+ PSPs, automated routing, three-way reconciliation, and line-item interchange audits into a single operating system, it turns static cost reporting into live transaction control. When a merchant spots an inflated scheme fee or an observable FX markup inside the dashboard, that data does not sit idle. It instantly becomes an actionable trigger to renegotiate a contract, update a gateway configuration, or deploy a controlled routing test.
The reverse is equally critical: smart routing requires observable economics. If a routing engine selects a path based on static rate cards while ignoring customer retries, dispute fees, and post-settlement adjustments, optimization will faithfully pursue the wrong target.
This closed-loop architecture is backed by enterprise scale. Processing over USD 1 Trillion in annual volume across 150+ countries and 300 million daily transactions at 99.999% uptime, Juspay provides the infrastructure required to capture payment data at its lowest grain and execute routing decisions in milliseconds. It does not replace the hard work of negotiating commercial contracts, but it gives your finance and engineering teams the exact operating system required to enforce them.
Key takeaways
- The Core Definition: Payment cost observability is the data architecture that answers four specific questions for every transaction: what it cost, why it cost that amount, whether it adhered to the signed PSP contract, and the confidence score of that calculation.
- Multi-Layer Cost Isolation: Actual, expected, settled, invoiced, and allocated costs must be recorded as independent data layers; blending them into a single "net" figure makes billing errors mathematically impossible to audit.
- Granular Event Modeling: Defensible transaction models track individual checkout attempts and lifecycle events (authorizations, captures, disputes) as separate rows, rather than flattening a payment into a single order-level fee.
- Dual-Taxonomy Governance: True cost lineage requires preserving the processor's raw, unedited billing code directly beside your standardized internal category, with all commercial contract rates strictly versioned by date.
- Overhead Separation: Fixed monthly vendor charges (gateway fees, platform minimums) are portfolio-level facts; whenever they are allocated down to an individual transaction, the underlying mathematical distribution rule must remain explicitly visible.
- Holistic Benchmarking: Valid PSP comparison requires benchmarking like-for-like cohorts, weighing headline fee differences against authorization success rates, gateway uptime, fraud exposure, and settlement speed.
- Total-Economic Routing: The processor with the lowest headline rate does not guarantee the lowest net cost; cost-based routing is a constrained optimization model that solves for final settled margins after retries and post-payment fees.
Frequently asked questions
What is payment cost observability?
Payment cost observability is the ability to attribute, explain, and verify payment costs across transactions, settlements, provider fee reports, invoices, contracts, FX, and post-payment events. It differs from ordinary reporting because it calculates expected cost, identifies unexplained variance, and preserves the evidence behind every result.
How do I calculate the true cost of a payment transaction?
Add directly attributable interchange, network, provider, FX, authentication, risk, refund, dispute, and adjustment fees, then subtract applicable credits. Show fixed, minimum, and invoice-only allocations separately. The calculation must state its denominator, lifecycle stage, currency treatment, tax policy, and excluded TCO items.
What is the difference between interchange, scheme fees, and PSP markup?
Interchange is generally a transfer between the acquiring and issuing sides of a card transaction. Scheme or network fees pay for network services and assessments. PSP or acquirer markup covers the provider’s commercial services. The merchant’s contracted price may separate these components or combine them into a blended rate.
How do merchants reconcile interchange and scheme fees?
Merchants reconcile fees by mapping raw provider fee codes to a canonical taxonomy, linking fee events to payment and settlement records, calculating expected charges from versioned rate rules, and reconciling invoice totals. Any unmatched amount should retain a reason, source, confidence level, and investigation status.
How should fixed monthly payment fees be assigned to transactions?
Fixed fees should remain invoice-level facts and be allocated only for a declared analytical purpose. A merchant may allocate by transaction count, payment volume, active account, or another activity driver. The model must store the allocation rule and label the result as allocated rather than directly observed.
Can the cheapest PSP reduce total payment costs?
Not always. A lower provider fee can be offset by lower authorisation, more retries, higher FX cost, slower settlement, weaker reliability, or different dispute outcomes. Compare eligible routes for a controlled transaction cohort and apply minimum performance, risk, resilience, and commercial constraints.
How does payment orchestration use cost observability?
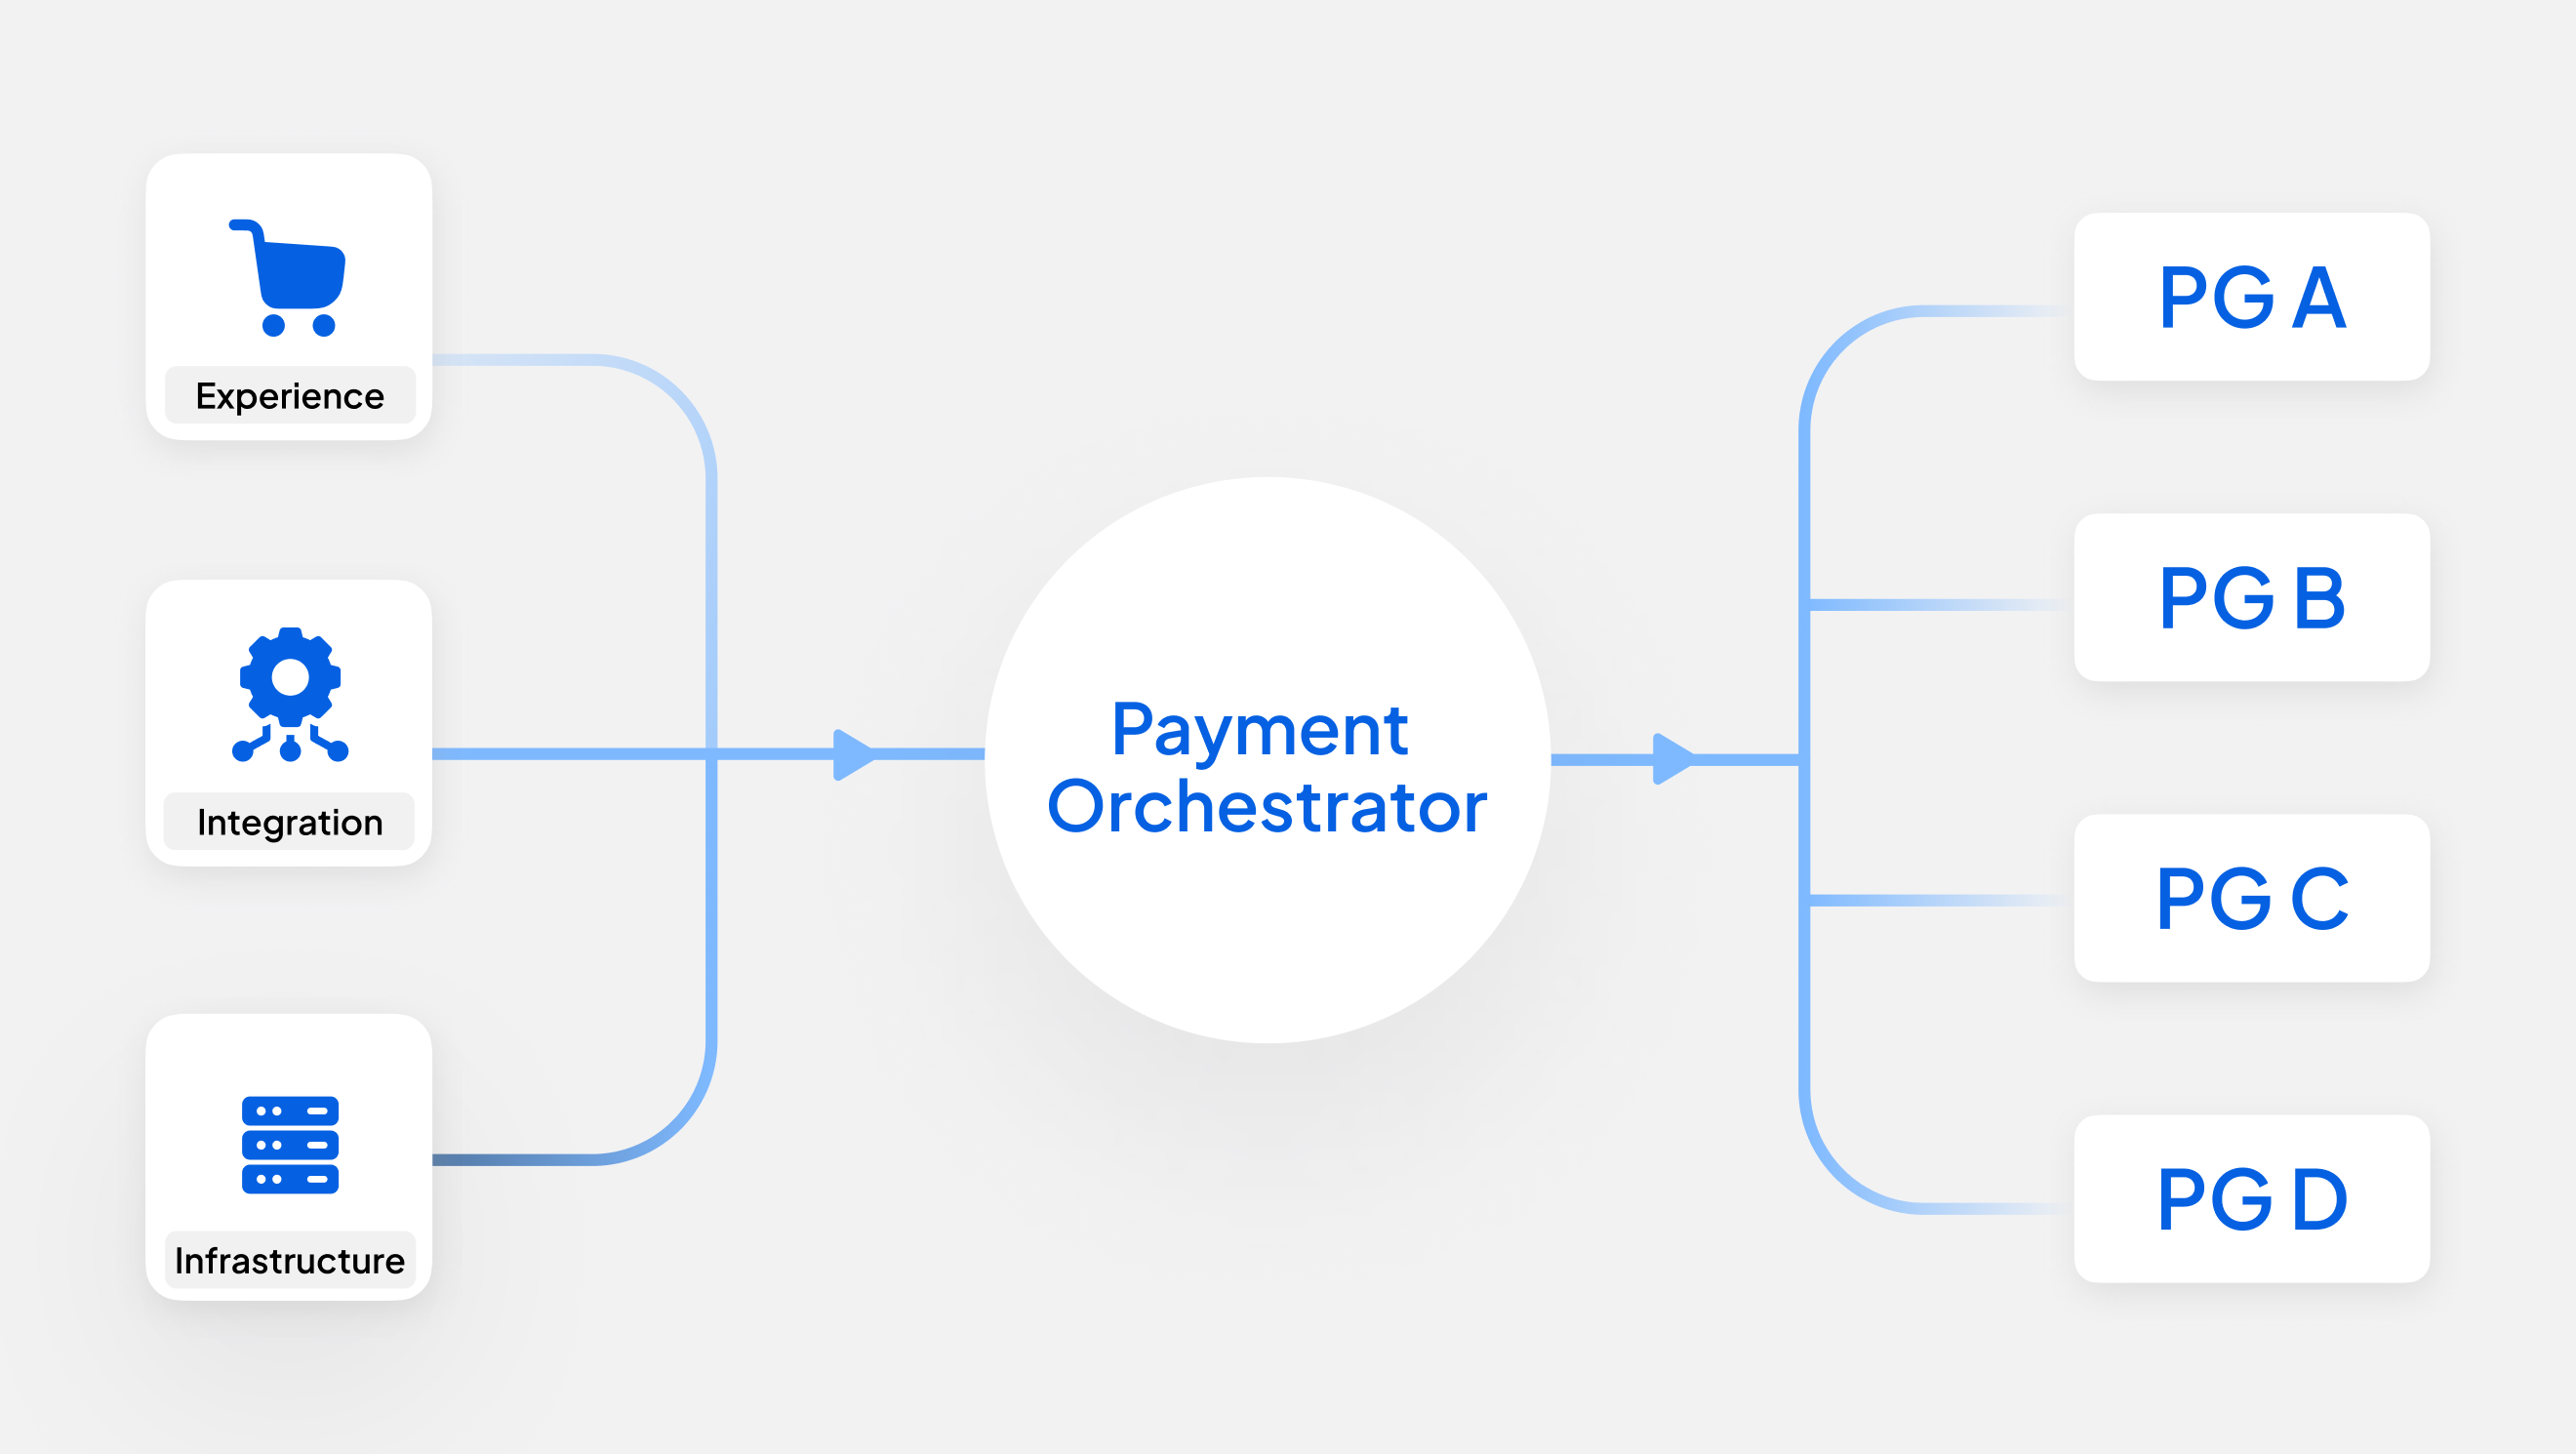
Payment orchestration uses cost observability as its financial brain, turning static fee reporting into automated routing decisions. It creates a continuous two-step loop:
- Before the transaction (Smart Routing) : The orchestration engine reads your live observability data, including normalized contract rates, processor performance, and true FX spreads, to automatically route each checkout to the most cost-effective provider.
- After the transaction (Auditing the Fix) : Observability measures the settled results afterward, giving your team hard proof that a routing change actually lowered your all-in costs without hurting authorization rates or system reliability.
How does Juspay support payment cost observability?
Juspay brings orchestration, multi-provider connectivity, reconciliation, reporting, and fee-audit capabilities into one operating layer. A merchant can use normalised payment and cost data to investigate billing, compare providers, and inform controlled routing decisions. Exact coverage depends on available provider data, commercial terms, and the merchant’s configured scope.